MSc Management Data Driven Decisions for Business Assignment Sample 2023
Task 1 Introduction and project plan of “ Bangles International Jewelry (BIJ)”
Data analysis is the process firms use to process the market data collected from both official and unofficial resources. The process examines the data and identifies the trends and information about the market data and helps in forming effective decisions. The data analysis is conducted by specific systems implemented by forms to get accurate results.
The analysis of the required data made by the research analyst has performed the quantitative and qualitative methodologies. Business uses specific software, methods, and tools of accounting and business for the analysis. In this report, the project plan of BIJ and the effect of the campaign held in the market in terms of change in performance have been assessed.
1.1 Objectives of the report
The purpose of the report is to measure the positive effect the marketing campaign that was held in the UK has on the performance of the business (You and Wu, 2019). The report analyzes the benchmark of performance improvement that has been achieved by “BIJ” after the campaign.
1.2 Project plan

“Bangles International Jewelry” faced some issues and sought effective suggestions for improving its business operation and further expansions (Clark et al. 2020). The consultancy will make the effort of analyzing the market trends and the organizational structure of BIJ by performing data analysis.
The Findings of the project will provide an effective assessment of the sales performance of BIJ. The effective interpretation of the result and implementation of the same in the business will enable the business to improve its position (Yablonsky, 2019). The effect of the campaign held in May 2020 will be measured by the change in the performance of the business from the sales volume.
1.3 Data analytics framework
The framework of data analytics provided an outline of the performance of an organization using a variety of tools and processes. Data analysis has four components in general: descriptive analysis, diagnostic analysis, predictive analysis and prescriptive analysis (Williams et al. 2020).
The framework used in this particular project based on the suggestion of the consultant is the diagnostics analytical framework. BIJ operates in the markets of Africa, South America and Australia. Even Though the company is the smallest in its market, competitors like LVMH, Signet and Cartier are hoping to level up in terms of competition.
1.4 Performance indicators and the method of improvement
The key performance indicators that help in the measurement of the performance of the business have been discussed here. The preferences and behavior of the customer are some of the major techniques which can be used to measure the performance indicators. The customer base, Revenue position, net income, operating profit, and net worth are what indicate the performance of the business (Ballou et al. 2018).
Customer engagement and revenue identify the market position of the business. The operating profit and Net worth of BIJ can indicate the valuation of the business. These key indicators and the improvement of their position can make the business of BIJ uplift its market position.
Task 2 Identification of issues and their solutions
2.1 Identification of the issue
The usual issue of the information used for analysis is the quality of the data which has been sourced. The information that is analyzed could be collected by the methods of qualitative and quantitative (Arunachalam and Kumar, 2018). The information collected using the approach of qualitative kind uses interviews, and questionnaires among the participants of the research, The data sourced in this method is derived from a focused and controlled environment.
The information collection method is influenced by the environment, particular preferences, ideals and biases (Çanakoğlu et al. 2018). The data which has been sourced using the approach of qualitative has a wide range of data sets and the information is more dispersed. The data has a lack of relevance and needs to be effectively and systematically sorted before the process of analysis.
The usage of this vast data set has particular challenges specific to these types of data sets only.
BIJ needs to run its operation based on the preferences of its consumers. The company has to identify the trend of the market (Carillo et al. 2018). The company has figured out the market not only in the area in which it is operating but in the region, and it wants to expand its operations and distributions as well. In the assessment of the market trend and consumer behaviour, the data shown can have duplicate entities.
The data can be repetitive and not have a proper structure. The analysis will be responsible for sorting the data in terms of omitting the entries that are duplicates and in terms of relevance and according to the structure. The g huge data can be accessed by multiple people in the process of cleansing and analyzing it can raise security-related issues.
The information processed by the analyst has the financial, confidential information of the company (Chatterjee et al. 2021). The intellectual property of the company such as the employee’s information, credentials and the future goals and movement of the business is also at risk of losing confidentiality.
2.2 Addressing the issues that have been identified
The issues faced by BIJ are similar as it is using a large portion of big data (Dawson, 2021). The business dealing with big data is affected by the issue of instances of having Data that are duplicates, having unstructured information, and security issues as faced by BIJ. Recommended by the consultant analyzing the structure of BIJ business has suggested an effective model of framework mitigate these issues (Elgendy et al. 2022).
The business uses historical data, consumer behavior data and feedback in the previously conducted analysis. The project plan formed by the consultant has suggested improving its existing framework. The company will include effective statistical tools and software to sort and review the sourced data and ensure competent analysis with ensuring security.
Task 3 Data analysis and discussion
3.1 Trend analysis
“Bangles International Jewelry” sales performance has been analyzed for three years from 2018 to 2020 on a monthly basis. The volume of sales and the value of those respective volumes of sales indicate the performance of BIJ from the sales perspective.
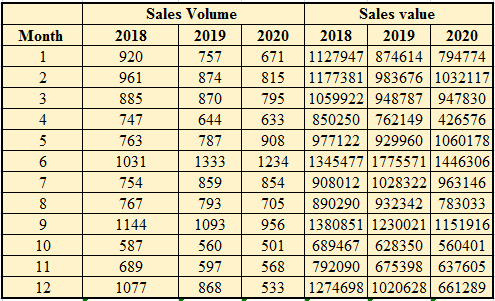
Table 1: Sales trend with the effect of volume and value
The above figure represents the trend of BIJ sales for the time frame of 2018 to 2020. The sales figures shown in the table represent the volume and the values of sales Made in a respective year (Fruhwirth et al. 2020). The volume of sales for the period of 2018 started with the number of 920 and went through many fluctuations and got to 1077.
The value of sales has not seen much of a change during this period as it started at 1127947 and got to 1274679. The sale volume for the year 20198 has experienced consistency and represented an increase in revenue towards the end. The overall sales performance of BIJ has seen a decline in 2020 as the revenue got affected by the volume of sales decreasing.
3.2 Benchmark comparison
The sales performance of “Bangles International Jewelry ” has been compared with the benchmarks that have been set on a quarterly basis.
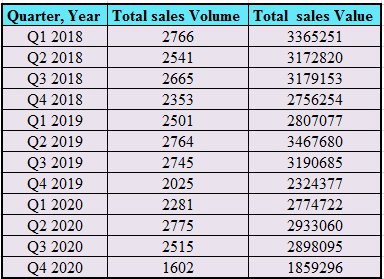
Table 2: Reflection of the value and volume of BIJ’s sales on a quarterly basis
The figure above reflects the sales volume and sales value of BIJ, the sales value of 2018 in its first quarter has been 2766. The sale volume of the year in the last quarter has further lowered to 2323. The volume of sales for 2019 has seen a decline as well and the sales volume of 2020 has experienced a sharp drop from 2115 to 1602.
3.3 Comparison of the volume-based benchmark with the value of sales
The sales performance of BIUJ in the regions of Japan, USA and UK market has been compared for the specific period of 2018-2020.
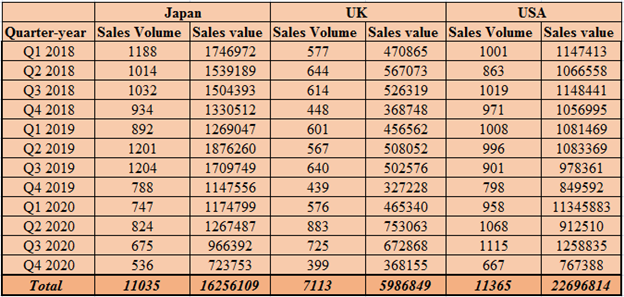
Table 3: Comparison of the sales value and sales volume of different markets
The figure shown above has reflected the quarterly sales figures of BIJ in terms of value and volume for the period. The total volume of sales in the USA has been identified to have surpassed the sales made in the UK and Japan. The sales volume of the USA market has been higher compared to the other two in every quarter of these three years (Ludbrook et al. 2019).
The total sales volume of the USA market was at 22696814 and the sales volume of Japan and the UK has been found at 16256109 and 5986849 respectively.BIJ business operation in the UK market has not done enough as it has clearly had the weakest performance comparing the other two countries.
Task 4 Graphical representation and interpretation
4.1 Comparison of the volume of sales relating to trends
The sales volume and sales values of BIJ in the UK, USA and the market of Japan have been represented here with the help of graphs.
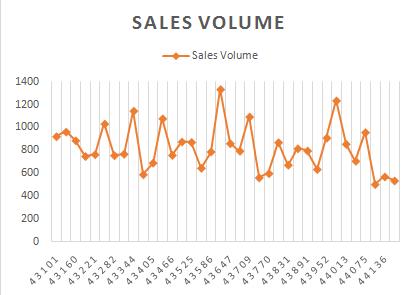
Figure 1: Chart A Comparison of the market trends and the volume of sales
The graph above is helping in developing an understanding of the performance of the business in the different markets. The sales volume and figures for the period of 2018 to 2020 of these three years have been reflected in the graph.
Examining the figures of sales it can be seen that the sales performance of the company starting from Jan 2018 has declined with the decline of irts volume of sales from 920 to 533 in December of 2020. The sales value of BIJ in these different regions has been compared to identify the sales trend of the business in different regions.
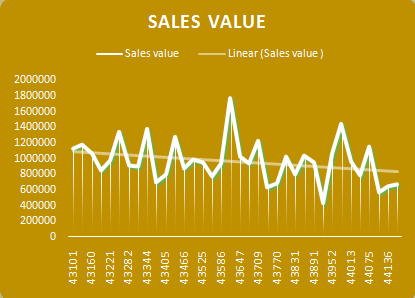
Figure 2: Comparison of the sales value and trends of the market
The above graph is reflecting a visual representation of the value of sales acquired by the company in specific markets (de Langhe and Puntoni, 2021). The trends of different markets have been assessed based on the comparison of sales performance (Long, 2018).
The comparison of the sales value of the company started in the year 2018 with 1127947 and the sales value declined to 661289 at the end of the period 2020.
4.2 Comparing the performance based on category
The volume of BIJ’s sales has been compared based on different categories. The sales volume has been examined in every quarter of these three years.
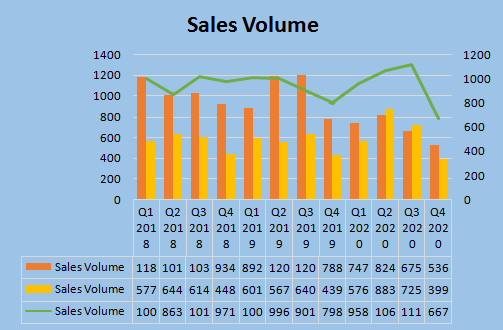
Figure 3: Chart B Performance comparison of different market
The graph above reflects the sales value of BIJ and the differences in the performance of the business. The sales volume of the business from every market can be analyzed by looking at the graph. The sales volume from every region has been denoted by different colors in the graph (Ma et al. 2020).
The sales of the UK have been identified to be the lowest and have been identified as 399. The market performance of the BIJ has been the most effective in the US market at 667 in 2020 in its last quarter.
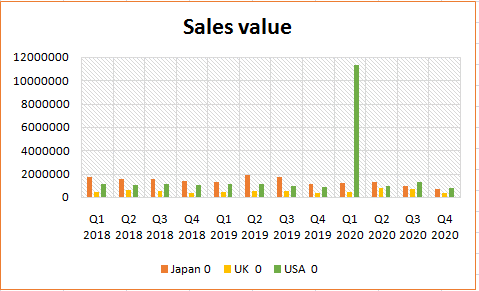
Figure 4: Sales value comparison in different market
The graph shown above reflects the difference in sales value in different countries. The sales value increased in the USA market in 2020 in its first quarter is 11345883 which is the highest. The revenue made by the firm from the other two countries in this period has been consistent except for the USA market.
4.3 The impact of the campaign is seen in different markets
The effect of the campaign that was held in the UK in May 2020 has been analyzed in this section.
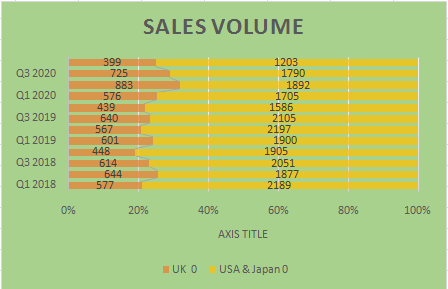
Figure 5: Impact of the campaign on the volume of sales
The above figure represents the changes in the performance of the4 businesses affected by the4 camping judging the sales volume (GAUTAM and BHIMAVARAPU, 2022). The sales volume of the business in the UK market in the first quarter of 2020 has been identified to be higher. The value declined afterwards which showed no direct effect of the campaign on the sales performance of the business.
During the process, it also needs to be considered that in the second quarter the UK economy was severely affected by the adverse effect of the pandemic (Sarker, 2021). Due to the effect of the pandemic on businesses all over the world, the effectiveness of the campaign cannot be measured accurately.
The value of sales of the company with the change seen in the timeframe before and after the marketing campaign has been analyzed here.
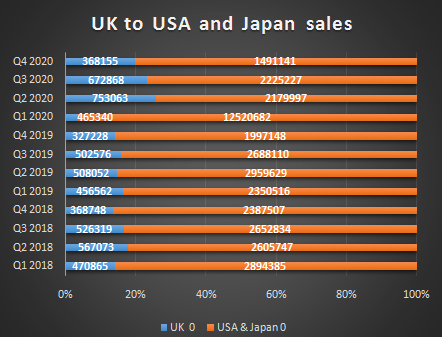
Figure 6: Impact of Marketing on the value of sales
The above figure outlines the impacts of the campaign in successfully increasing the sales number of BIJ. The campaign he held in may 2020 by that time the pandemic has already affected a majority of the population all around the globe (Troisi et al. 2020). The UK business has received a severe blow during this time as well.
This affected the business in measuring the changes in the sales performance of the business from the effectiveness of the campaign as the effect of the pandemic was included in the sales figures as well (Riley et al. 2021). Analyzing the value of sales carefully before the campaign and after the campaign has seen to have a slight increase in the UK market but shortly after it depleted again.
Task 5 Conclusions and recommendations
5.1 Conclusion
The business activities of BIJ have been seen to have made the most p revenue and profit from the market in the USA. The information that has been sourced and processed has been shown in the report in tabular and graphical format. The company has sought to further expand its businesses in other regions such as Australia, South America and Africa as well.
The business has not ventured into distributing its products in these regions and the experience of the business in operating in countries like the USAA, Japan, and the UK has helped the company to make proper decisions related to these. The different consumer preferences, behavior, purchasing power, and demand all have been assessed and compared from the data collected from the businesses of these regions. The company has developed an understanding of its sales structure, the preferences of its consumer and how it changes with the exchange of markets.
5.2 Recommendations
The BIJ has implemented the suggestion they received from the consultancy services. The analytics and collecting framework previously used in the company has been suggested with some changes and enhancements. The business goals of expanding its area of operation and distribution in other countries will have the effect of the pandemic.
The demand in the market has decreased due to the economical crisis and shift, and the perception of consumers has been influenced by this as well. The campaign held in the UK was not ineffective as it increased its sales performance for a short period of time. The business has been suggested to implement the findings of the data analysis to understand its capacity and gold in the market. The company has been suggested to utilize the current market trends and include marketing and advertising strategies in optimizing its customer engagement.
References:
Arunachalam, D. and Kumar, N., 2018. Benefit-based consumer segmentation and performance evaluation of clustering approaches: An evidence of data-driven decision-making. Expert Systems with Applications, 111, pp.11-34.
Ballou, B., Heitger, D.L. and Stoel, D., 2018. Data-driven decision-making and its impact on accounting undergraduate curriculum. Journal of Accounting Education, 44, pp.14-24.
Çanakoğlu, E., Erzurumlu, S.S. and Erzurumlu, Y.O., 2018. How a data-driven entrepreneur analyzes imperfect information for business opportunity evaluation. IEEE Transactions on Engineering Management, 65(4), pp.604-617.
Carillo, K.D.A., Galy, N., Guthrie, C. and Vanhems, A., 2018. How to turn managers into data-driven decision makers: Measuring attitudes towards business analytics. Business Process Management Journal.
Chatterjee, S., Chaudhuri, R. and Vrontis, D., 2021. Does data-driven culture impact innovation and performance of a firm? An empirical examination. Annals of Operations Research, pp.1-26.
Clark, A., Zhuravleva, N.A., Siekelova, A. and Michalikova, K.F., 2020. Industrial artificial intelligence, business process optimization, and big data-driven decision-making processes in cyber-physical system-based smart factories. Journal of Self-Governance and Management Economics, 8(2), pp.28-34.
Dawson, A., 2021. Robotic wireless sensor networks, big data-driven decision-making processes, and cyber-physical system-based real-time monitoring in sustainable product lifecycle management. Economics, Management and Financial Markets, 16(2), pp.95-105.
de Langhe, B. and Puntoni, S., 2021. Leading with decision-driven data analytics. MIT Sloan Manag. Rev., 62, pp.14-16.
Elgendy, N., Elragal, A. and Päivärinta, T., 2022. DECAS: A modern data-driven decision theory for big data and analytics. Journal of Decision Systems, 31(4), pp.337-373.
Fruhwirth, M., Ropposch, C. and Pammer-Schindler, V., 2020. Supporting Data-Driven Business Model Innovations: A structured literature review on tools and methods. Journal of Business Models, 8(1), pp.7-25.
GAUTAM, R.S. and BHIMAVARAPU, V.M., 2022. Data Driven Decision Making: Application in Finance. Iconic Research and Engineering Journals, 5(12), pp.52-56.
Long, Q., 2018. Data-driven decision making for supply chain networks with agent-based computational experiments. Knowledge-Based Systems, 141, pp.55-66.
Ludbrook, F., Michalikova, K.F., Musova, Z. and Suler, P., 2019. Business models for sustainable innovation in industry 4.0: Smart manufacturing processes, digitalization of production systems, and data-driven decision making. Journal of Self-Governance and Management Economics, 7(3), pp.21-26.
Ma, Z., Ren, Y., Xiang, X. and Turk, Z., 2020. Data-driven decision-making for equipment maintenance. Automation in Construction, 112, p.103103.
Riley, C., Vrbka, J. and Rowland, Z., 2021. Internet of Things-enabled sustainability, big data-driven decision-making processes, and digitized mass production in Industry 4.0-based manufacturing systems. J. Self-Gov. Manag. Econ, 9, pp.42-52.
Sarker, I.H., 2021. Data science and analytics: an overview from data-driven smart computing, decision-making and applications perspective. SN Computer Science, 2(5), pp.1-22.
Troisi, O., Maione, G., Grimaldi, M. and Loia, F., 2020. Growth hacking: Insights on data-driven decision-making from three firms. Industrial Marketing Management, 90, pp.538-557.
Williams, A., Suler, P. and Vrbka, J., 2020. Business process optimization, cognitive decision-making algorithms, and artificial intelligence data-driven internet of things systems in sustainable smart manufacturing. Journal of Self-Governance and Management Economics, 8(4), pp.39-48.
Yablonsky, S., 2019. Multidimensional data-driven artificial intelligence innovation. Technology innovation management review, 9(12), pp.16-28.
You, Z. and Wu, C., 2019. A framework for data-driven informatization of the construction company. Advanced Engineering Informatics, 39, pp.269-277.
