MSc Management Data Driven Decisions for Business Assignment Sample 2023
Task 1: Introduction and project plan
Data analysis is an effective tool through which a business can increase its decision-making process and competitive advantages. This study is based on consultancy based on Wood from the Trees (WFTT). This company has decades of experience in providing service of consultancy to businesses by which they can enhance their performance in the global market.
In this study, data analysis of a company named Bangle International Jewelry has been done. Data collected from the period 2018 to 2020 has been analyzed in this study to highlight the revenue of businesses in different countries.
BIJ is currently operating in major continents such as Asia, Europe and South America. This company is currently conducting a market campaign in the UK in May 2020. Thus, the primary objective of this study is to highlight the impact of the campaign on the financial position of BIJ in the UK market.

In the current era of the market and industry dynamism has a significant impact on the company’s performance. Other than this large number of competitors in the market lead to affect the company’s strategic position in the market. In this institution use of effective decision-making provides the opportunity for the BIJ to enhance its performance in the market.
Task 2: Data quality issues and remedies
The data quality issues are one of the major challenges that have been generated with the fences to a better effective process of data analysis. Therefore, in the way analyzing the effective data process, it is quite essential to reduce the duplication of data chance.
As per the view of Andrews et al (2020), in the current era related to the market where data analysis has played a major role in the way of making decision processes for the organization. It is quite necessary for the organization and business for maintaining the data uniqueness and also the information. It happened because of the data duplication related to the business for making sure better competitive market advantages.
Data format inconsistent
It is another challenge which has been generated with constraints in the systematic and effective data analysis. It is the inconsistent format process which has shown negative issues at the time of data processing. As per the view of format and Calic (2019), data is stored sometime in the divergent structure which generates fences at the time of identifying and choosing the products.
It mainly belongs to the same kind of data category and also management times on the issues related to the inappropriate outcome which have been published with the data analysis related to the BIJ. Along with that, it has been determined with the absence related the data consistency for data generated the fences in impact assessment related to the UK’s market campaigns.
Inappropriate record
In the process of decision-making performance of the organization is directly related to the process of data analysis. Thus, with the effect of that, the decision-making success depends on data adequacy and quality (Ghasemaghaei and Calic, 2019). In the current situation, the BIJ has faced some kind of issues at the time of data completeness and also the records system.
In this kind of situation, the management has also faced challenges at the time of making decisions on the data areas which have incomplete and inappropriate areas. For example, if the organization’s management has been absent information in the finance department field in the economic terms related to affected financial resources. Thus, with the effect of that its completeness and adequacy play a major role in the way of the data analysis process and also the process of decision making.
To determine the issues in reducing the data
Obtain the tools of reducing the duplicating data
As per the basis of analysis, it has been given the impact on the data duplication and also the information on the process of data analysis. It has been determined with a better process of data analysis negatively impacts data duplication (Ul-Hameed et al. 2019). In this kind of situation, the data duplication has been used for giving a better wide range related to the scope of BIJ and also the data analysis required for maintaining the duplicate chance in sample size and also the data.
Effective management of data system implication
In the absence of completeness and consistency in the record system, it generated the fences for the analyzed data. It ultimately shows the outcome from the data as per the basis of the effective implication of data system management like big data analysis directs for increasing the management of data.
Task 3: Data analysis and commentary
The trend in sale value and volume by year
In this section of the study detailed analysis of the company’s performance in a different country over years has been highlighted. Based on the table it has been found that Japan’s sales volume in 2018 stood at 4168 which declined in the next year and stood at 4085 in 2019. Hence, it has been found that the company’s performance in Japan will decline in 2019 (Cho et al. 2019). A further decrease has been witnessed in the financial year 2020 as the total sale value stood at 4132431.05 pounds.
| MARKET | Year | Sum of Sales Value | Sum of Sales Volume |
| JAPAN | 2018 | 6121066.37 | 4168 |
| 2019 | 6002611.52 | 4085 | |
| 2020 | 4132431.05 | 2782 | |
| United Kingdom
|
2018 | 1933005.56 | 2303 |
| 2019 | 1794417.09 | 2247 | |
| 2020 | 2259426.14 | 2583 | |
| USA
|
2018 | 4419406.72 | 3854 |
| 2019 | 3992790.7 | 3703 | |
| 2020 | 4109561.55 | 3834 |
Table 1: trend in sale value and volume by year
(Source: self-created)
In this situation, it can be said that due to the impact of covid performance, the BIJ performance declined in 2020 (Seetharaman,2020). On the other hand, an analysis of the UK’s performance in all three years found that in 2018, BIJ had a total volume of 2303 and a sales value of 1933005.56 pounds. The decline in sale value and volume has been noticed in 2019 but this company is able to generate more sales in 2020.
Category performance covering sale value and volume
BIJ deals in products such as accessories, bangles, rings, necklaces, bracelets and headbands. Based on analysis of the performance of each product in the market it has been found that in the USA most sold products stood at Bracelets.Around 5369 units of bracelets have been sold in this market which stood around 50% of the total sale.
In this situation, it can be said that the performance of the company is quiet in the USA. As per the view of Yoon and Chung, (2018), it has also found that the company’s sales have increased in all three financial years which highlights that the strategic position of the BIJ has increased in the USA market.
| Row Labels | Sum of Sales Volume | Sum of Sales Value |
| Japan | 11035 | 16256108.94 |
| Accessory | 155 | 305179.89 |
| Bracelet | 834 | 901162.74 |
| hairband | 8403 | 12616479.58 |
| Necklace | 1024 | 1743502.63 |
| Ring | 619 | 689784.1 |
| United Kingdom | 7133 | 5986848.79 |
| Accessory | 113 | 163317.66 |
| Bracelet | 4836 | 3880093.78 |
| hairband | 462 | 399147.79 |
| Necklace | 929 | 1003450.93 |
| Ring | 793 | 540838.63 |
| USA | 11391 | 12521758.97 |
| Accessory | 306 | 571301.93 |
| Ankle bracelet | 10 | 2500 |
| Bracelet | 5369 | 4978824.71 |
| hair bands | 2701 | 3129257.23 |
| Necklace | 2073 | 2877528.41 |
| Ring | 932 | 962346.69 |
| Grand Total | 29559 | 34764716.7 |
Table 2: Category performance covering sale value and volume
(Source: self-created)
Based on the analysis of the UK market category performance it has been found that in the UK market product name Bracelets is highly sold. It covers more than 50% of total sales generated in three years.
Comparison of sale value and volume between markets quarterly
Based on a comparison of the sale value and volume markets it has been found that BIJ generates a major portion of sales from countries such as the USA and Japan. BIJ generated a total sale value of 16256108.94 pounds in 2019 in which the first quarter had higher sales. On the other hand, in 2019 this company’s performance in terms of generating revenue declined. BIJ observers in the last quarter of 2019 generated only 1147556.16 pounds.
| Row Labels | Sum of Sales Volume | Sum of Sales Value |
| Japan | 11035 | 16256108.94 |
| 2018 | 4168 | 6121066.37 |
| 1-3 | 1188 | 1746972.16 |
| 4-6 | 1014 | 1539189.11 |
| 7-9 | 1032 | 1504393.31 |
| 10-12 | 934 | 1330511.79 |
| 2019 | 4085 | 6002611.52 |
| 1-3 | 892 | 1269046.77 |
| 4-6 | 1201 | 1876259.57 |
| 7-9 | 1204 | 1709749.02 |
| 10-12 | 788 | 1147556.16 |
| 2020 | 2782 | 4132431.05 |
| 1-3 | 747 | 1174799.03 |
| 4-6 | 824 | 1267486.65 |
| 7-9 | 675 | 966392.34 |
| 10-12 | 536 | 723753.03 |
| United Kingdom | 7133 | 5986848.79 |
| 2018 | 2303 | 1933005.56 |
| 1-3 | 577 | 470865.48 |
| 4-6 | 664 | 567073.01 |
| 7-9 | 614 | 526319.16 |
| 10-12 | 448 | 368747.91 |
| 2019 | 2247 | 1794417.09 |
| 1-3 | 601 | 456561.63 |
| 4-6 | 567 | 508051.62 |
| 7-9 | 640 | 502575.68 |
| 10-12 | 439 | 327228.16 |
| 2020 | 2583 | 2259426.14 |
| 1-3 | 576 | 465339.89 |
| 4-6 | 883 | 753063.48 |
| 7-9 | 725 | 672867.93 |
| 10-12 | 399 | 368154.84 |
| USA | 11391 | 12521758.97 |
| 2018 | 3854 | 4419406.72 |
| 1-3 | 1001 | 1147413.03 |
| 4-6 | 863 | 1066558.01 |
| 7-9 | 1019 | 1148440.9 |
| 10-12 | 971 | 1056994.78 |
| 2019 | 3703 | 3992790.7 |
| 1-3 | 1008 | 1081468.67 |
| 4-6 | 996 | 1083369.27 |
| 7-9 | 901 | 978360.52 |
| 10-12 | 798 | 849592.24 |
| 2020 | 3834 | 4109561.55 |
| 1-3 | 958 | 1134582.6 |
| 4-6 | 1068 | 912509.58 |
| 7-9 | 1115 | 1258835.08 |
| 10-12 | 693 | 803634.29 |
| Grand Total | 29559 | 34764716.7 |
Table 3: Comparison of sale value and volume between markets quarterly
(Source: self-created)
On the other hand, it has been found that the performance of the UK and US markets has increased in all financial years. As opined by Xie et al. (2019) increase in financial performance each year highlights that the company’s strategic position in the UK and USA has increased effectively over a period of time.
Task 4: Commentary on data charting
Comparison made on sales value trends.
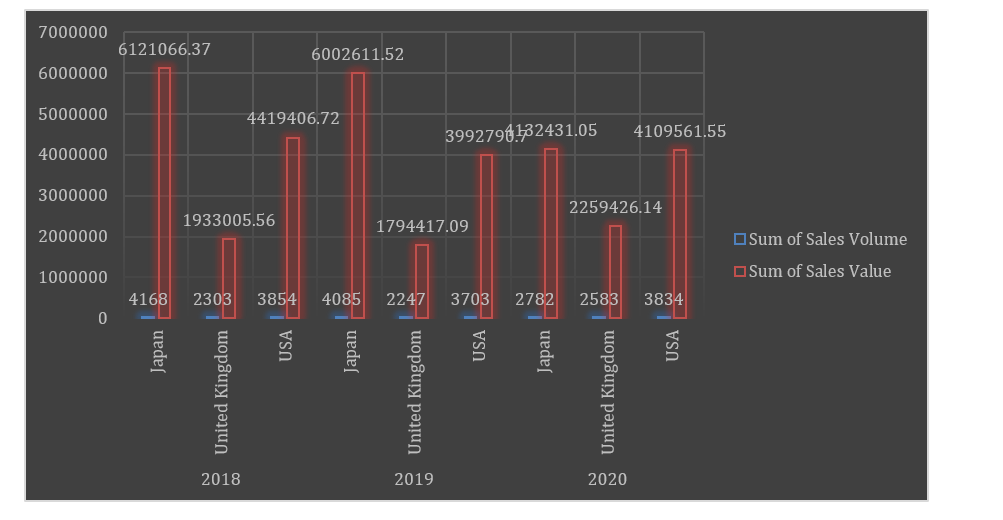
Figure 1: Sales Value trend
(Source: MS Excel)
Different marketplaces that consist of different products are highlighted in the above chart for the three years that are 2018, 2019, and 2020. The countries that have been taken in the order are “Japan, the United Kingdom, and the United States of America”. For preparing the chart the sum of all the marketplaces for the different years had been summed up.
In all three years, it can be seen that Japan has recorded the highest sales volume for the company which is 6121066.35, 6002611.52, and 4132431.05 dollars for the years 2018, 2019, and 2020 respectively. So, in 2018, Japan recorded the highest revenue.
In the United Kingdom, the company has recorded the second highest sales volume which is 2259426.14, 1794417.09, and 1933005.56 dollars for the years 2020, 2019, and 2018 respectively. The United Kingdom recorded its highest sales volume in 2020.
The sales volumes in the United States of America were 4419406.72, 3992790.7, and 4109561.55 dollars for the years 2018, 2019, and 2020 respectively. Same to Japan, The United States of America recorded the highest sales volume in 2018.
Inference
- Covid 19 started in 2019, so it can be seen that no country produced the highest sales volume in 2019. According to Fabeilet al. (2020) during the 1st phase of Covid19, there were many restrictions and bans on travelling abroad, due to which the footfall in the airport dropped drastically, this affected the revenue generated by the company from the shops they have at the airport.
- It can be seen that in 2020 USA and UK revenue increased compared to 2019 as the covid19 was mitigated to some extent and restriction on travelling was eased both internationally and domestically (Zhang, 2021).
- Japan was not hit by the covid19 to that extent in the first wave so the company was able to generate revenue in Japan in 2019. Japan was hit in the 2nd way of covid19 due to which there was a drop in the business in Japan (Yamori, and Aizawa, 2021). So, the sales dropped in 2020.
Comparison of the performance of different products.
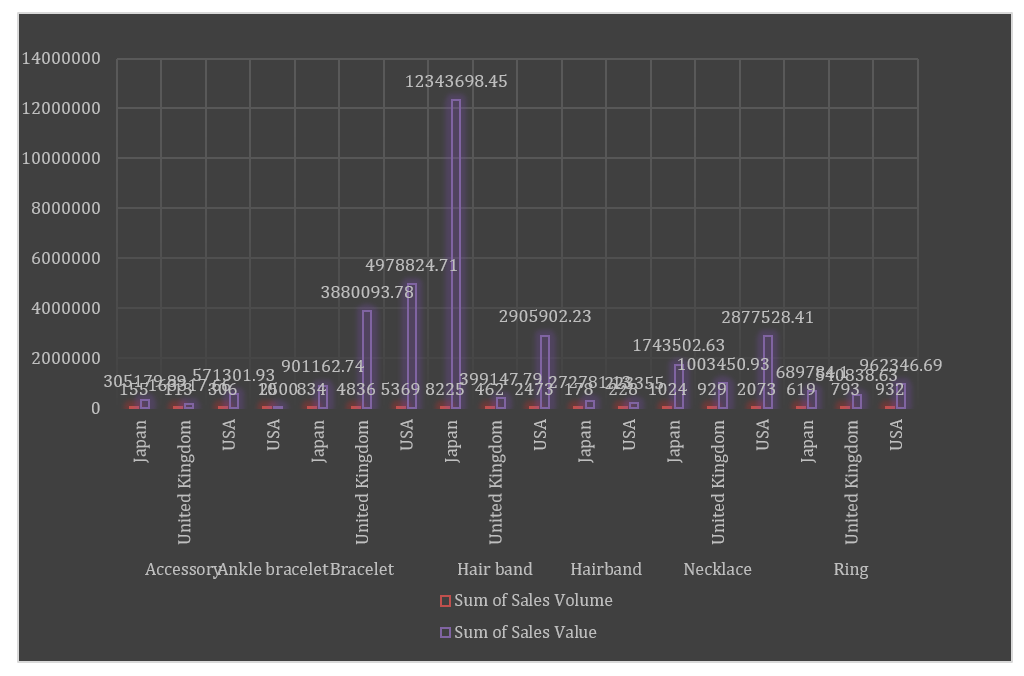
Figure 2: Sale Volume
(Source: MS Excel)
The performance of different products in the different marketplaces that the company sells can be seen in the above chart. The company operates in three marketplaces that are USA, UK, and Japan. The details of the product in the different marketplace are:
- The total revenue generated from bracelets by selling in all three markets was 9760081.23 dollars.
- Revenue generated from ankle bracelets was 2500 dollars that were only sold in the USA market.
- Revenue generated from the hair band was 15648748.87 dollars. It was also sold in all three marketplaces in which the company operated.
- Ring and necklaces generated revenue of 2192969.42 and 5624481.97 dollars respectively from all three markets.
- There were some other accessories that the company sold in the market, this generated a total revenue of 1039799.48 dollars.
Inference from the above data is:
- Most of the revenue that is generated by the company was from the Japan marketplace and that too by selling headbands.
- The company in the USA only sold ankle bracelets and generated low revenue from this product.
- A huge amount of the total revenue is contributed by the other accessories that the company sells in a different marketplace.
- The volume of hair bands and bracelets sold by the company are more or less equal but the revenue generated, this can be concluded that the price of a bracelet in comparison to a hair band is low.
Influence of marketing campaigns in the UK
Figure3: Sale volume in UK marketplace.
(Source: MS Excel)
As the above chart shows that there is a continuous rise in the volume of sales in the United Kingdom since 2018. Advertisement plays a huge role in expanding the business (Karako,et al. 2021). There would have been more rise in the volume in 2019 but due to the impact of covid.
The company did not show much rise in sales. But as the covid19 restriction was over it is seen that there is a tremendous rise in the sale4 volume in the UK market this shows that the company’s marketing strategy has given positive returns. There would be tremendous growth in the business as covid19 is mitigated (Fairlie, 2020).
Task 5: Self-evaluation
This is the study that is mainly related to many reasons such as data collection, remedies, and quality issues. It assists me to be concerned about the divergent data-driven process aspects. As this is the research that is mainly done on the basis of some of the major scenarios of BIJ organizations. It is useful for me in the way of understanding the process of executing the project at a specific time. This project has also been helpful for me to know about data charting and segregation of data as well.
While at the time of discussing the self-evaluation, I can observe the process of project management and the data-driven process for collecting the data within a specific time. I have also learned about the data-driven process of collecting data from accurate and suitable sources. It has assisted me to learn about the best techniques and tools which assist to make reliable and accurate data.
Task 6: Conclusion and Recommendation
Conclusion
From the various calculations and by analyzing different charts which were made from the data it can be concluded that the performance of the company is good and especially in Japan. Like every other company, BIJ ltd was also impacted by covid19 yet it survived. As the restriction will be cured, freedom in travelling will be provided the company will generate more revenue as well as profit.
Recommendation
Some of the recommendations that the BIJ group can implement to develop increase its revenue over time are:
- The company can list its products online and enter the e-commerce business. This will expand the reach of the customer base.
- The company should look beyond airports and open shops near tourist spots.
- The company can enter a new marketplace near Japan as they have covered the Japanese market very well
- The company can develop products that are of low cost to target the middle class and also customers from developing countries.
- The company can start promoting more products in the different marketplace that are being just sold in one marketplace.
Possible actions
The company should pay special focus on their R&D department as this industry keeps on changing in terms of customer taste and preference. There are always new fashions that are getting updated in the market and lagging behind will give an upper hand to the company’s competitors. The company should start focusing on low-cost products to surge its customer reach.
Reference list
Andrews, R., van Dun, C.G., Wynn, M.T., Kratsch, W., Röglinger, M.K.E. and ter Hofstede, A.H., 2020. Quality-informed semi-automated event log generation for process mining. Decision Support Systems, 132, p.113265.
Cho, S.J., Chung, C.Y. and Young, J., 2019. Study on the Relationship between CSR and Financial Performance. Sustainability, 11(2), p.343.
Fabeil, N.F., Pazim, K.H. and Langgat, J., 2020. The impact of Covid-19 pandemic crisis on micro-enterprises: Entrepreneurs’ perspective on business continuity and recovery strategy. Journal of Economics and Business, 3(2).
Fairlie, R., 2020. The impact of COVID‐19 on small business owners: Evidence from the first three months after widespread social‐distancing restrictions. Journal of economics & management strategy, 29(4), pp.727-740.
Ghasemaghaei, M. and Calic, G., 2019. Can big data improve firm decision quality? The role of data quality and data diagnosticity. Decision Support Systems, 120, pp.38-49.
Karako, K., Song, P., Chen, Y., Tang, W. and Kokudo, N., 2021. Overview of the characteristics of and responses to the three waves of COVID-19 in Japan during 2020-2021. Bioscience trends.
Seetharaman, P., 2020. Business model shifts: Impact of Covid-19. International Journal of Information Management, 54, p.102173.
Ul-Hameed, W., Shabbir, M., Imran, M., Raza, A. and Salman, R., 2019. Remedies of low performance among Pakistani e-logistic companies: The role of firm’s IT capability and information communication technology (ICT). Uncertain Supply Chain Management, 7(2), pp.369-380.
Xie, X., Huo, J. and Zou, H., 2019. Green process innovation, green product innovation, and corporate financial performance: A content analysis method. Journal of business research, 101, pp.697-706.
Yamori, N. and Aizawa, T., 2021. The impact of the first wave of the COVID-19 crisis on small and medium-sized enterprises and credit guarantee responses: Early lessons from Japan. Covid Economics, 63, pp.186-200.
Yoon, B. and Chung, Y., 2018. The effects of corporate social responsibility on firm performance: A stakeholder approach. Journal of hospitality and tourism management, 37, pp.89-96.
Zhang, H., 2021. The impact of COVID-19 on global production networks: Evidence from Japanese multinational firms.
