MSc Management Data Driven Decisions for Business Assignment Sample
Task 1
Introduction and Project Plan
Data analysis is when important information is passed through varied stages like cleaning, inspection, and transformation. Raw data is passed through all these stages and converted into another form because raw data cannot be used directly for analysis purposes as it has a lot of errors (Runkler, 2020). http://MSc Management Data Driven Decisions for Business Assignment Sample
This report is prepared to understand the impact of the marketing campaign on the sales performance of the BIJ. BIJ is operating in markets like the USA, U.K., and Japan. Signature stores of the firm are located in New York, London, and Mumbai and assist the firm in generating more sales in the business. WFTT is the firm to whom consultancy project is given regarding BIJ for data analysis purposes.
Project plan
- A data analytics framework will be used to analyze the data, which will guide the entire data analysis-related activity. Under this, data will be cleaned and then used for analysis purposes, and analysis will be done through a chart (Hariri, Fredericks and Bowers, 2019).http://MSc Management Data Driven Decisions for Business Assignment Sample The data analysis project will benefit BIJ in a number of ways.
- It will assist BIJ in improving its marketing efforts.
- Exploring the opportunity to generate more revenue in the business.
- Keep an up to date information on the taste and preferences of the customers and give them higher customer satisfaction.

The data analytics framework will take into account sales data on the BIJ, which is related to the three different locations. Under the data analytics framework, first of all, data cleaning will be done, and under this, changes will be made in data like misspellings will be made correct. Apart from this, after data cleaning, charts will be prepared, and data will be analyzed by developing tables. In this way, entire data analysis will be carried out.
Key Performance Indicators in BIJ
KPI refers to the key performance indicators under which some variable threshold limit is determined and actual performance is compared to that threshold limit to identify whether a firm gives a good or poor performance in the business (Domínguez and et.al. 2019). http://MSc Management Data Driven Decisions for Business Assignment Sample
KPI basically reflects the area of improvement for the business firm. KPI or key performance indicators may be qualitative or quantitative. Quantitative KPIs may like sales, employee turnover, profit, cost, etc. In the case of BIJ, KPI maybe like sales growth rate and the number of units sold in a year.
Task 2
Problems in Data quality and solutions
Data analytics is the mainly branch of science that mainly take into account raw data processing. Sometimes the problem may arise regarding data collection and interpretation, and if the wrong output is generated on the application of a data analysis tool wrong decision is made by the analyst (Wani and Jabin, 2018). http://MSc Management Data Driven Decisions for Business Assignment Sample
There are multiple ways in which data analysis is done, like it can be done through charts, by using basic tools like mean etc, which is also known as descriptive analysis. Other sorts of analytics are predictive, diagnostic, and prescriptive. In the report, through charts and graphs, data will be explored, and analysis will be done. Some of the data issues that can be faced by the analyst at WTFF are given below.
Lack of proper understanding: Many firms initially start their data analytics project and have a low budget, due to which they keep low experience staff at the workplace. These staff members have less knowledge of data cleaning and other data-related aspects (Alston, 2018). http://MSc Management Data Driven Decisions for Business Assignment SampleHence, due to this reason, the firm failed to maintain the quality of the data used for analysis purposes. The solution of this problem is that either firm can outsource its data analytics project to another company or hire some highly experienced personnel at the workplace to ensure that the data analytics project will be run smoothly.
Low-quality data: Often, data gathered is very low in quality because firms did not use the ETL process properly (Vicario and Coleman, 2020).http://MSc Management Data Driven Decisions for Business Assignment Sample ETL stands for extract, transform and load. Sometimes firms do not use advanced technology regarding ETL, and due to this reason, data cleaning issues remain.
The way I.T. infra develops also leads to data quality issues. If developers are not communicated with proper requirements, then there may be a poor transformation in the system, and this may lead to data quality issues at the workplace. In this regard, an example of the BIJ can be taken whose data contain a lot of errors like nation name, and product name being misspelled (Flyverbom, Deibert. and Matten, 2019). http://MSc Management Data Driven Decisions for Business Assignment SampleThis is an example of low-quality data. When that is used for analysis purpose, have a lot of issues it is assumed as poor quality of data and need more cleaning even if it was cleaned by the software or I.T. infra earlier.
Assumptions of the analytics tools like regression and t-test: Sometimes, on the application of some tools like regression analysis etc, analysts have to follow some assumptions regarding data like there must not be outliers etc. If these assumptions are not put into practice, and relevant changes are not made in the data, then in that case tool will show wrong results, and wrong decisions will be made by the analyst.
So, it is another quality issue as here individual judgment work more (Iqbal and et.al. 2018).http://MSc Management Data Driven Decisions for Business Assignment Sample If an individual remove outliers and it judges that all outliers are removed even if they are there, then low-quality data will be used for analysis purpose, and reliable output will not be generated on the application of the tool. So, these are some data quality issues.
Proposed solution
The solution to such a data-related problem is that the firm must ensure that there are multiple employees involved in checking data quality. When there are multiple employees, it will be ensured that the entire data is cleaned and there is no error (Raut and et.al. 2019.). http://MSc Management Data Driven Decisions for Business Assignment SampleMoreover, it will be ensured that data is according to the assumption regarding the specific analytics tool.
Task 3
Data analysis and commentary
Data and trends for Sales in different countries
| Fiscal year | Sales units | Revenue |
| 2018 | 2,303 | 19,33,006 |
| 2019 | 2,247 | 17,94,417 |
| 2020 | 2,583 | 22,59,426 |
| Total | 7,133 | 59,86,849 |
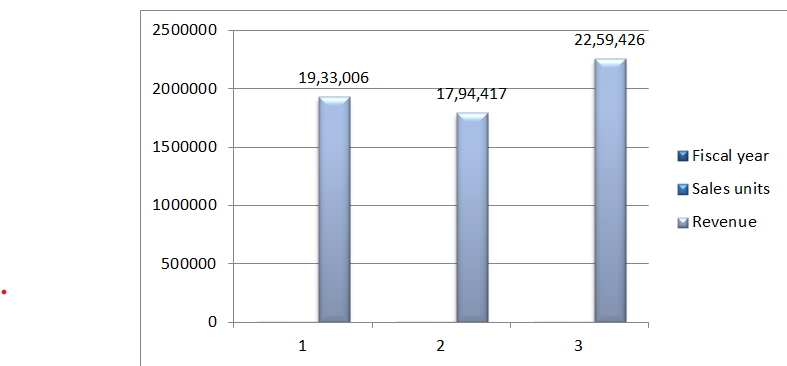
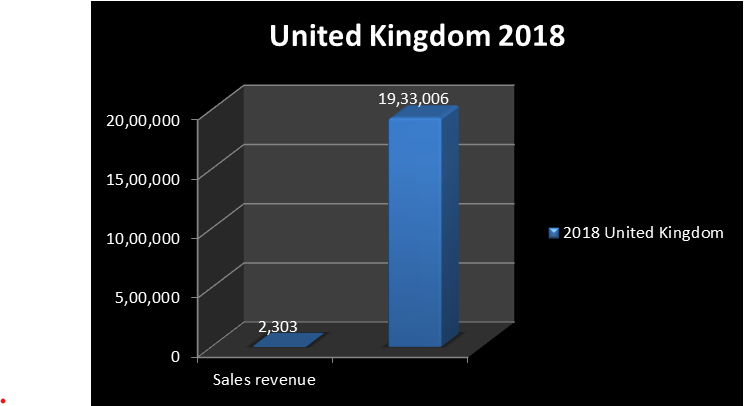
From the chart given above it can be observed that sales across the declined in the year 2019 relative to 2018, and again it gets increased in the year 2020. Hence, there is a lack of stability in sales. In the U.K., relative to the USA and Japan, overall sales value is low, and because of an effective marketing campaign firm observes good growth in sales in the year 2020. In comparison, it can be observed that in 2020 sales increased relative to 2019, and its value was more than the same of 2018, which also reflects that BIJ observed a good bounce back in sales in its business. This reflects that firm fundamentals in the U.K. market are strong, and a decline in sales in 2019 can be considered an uptrend in business, which is very normal. This also reflects that firm gets good results from its marketing efforts in the business.
| Fiscal year | Sales units | Revenue |
| 2018 | 3.854 | 44,19,407 |
| 2019 | 3,703 | 39,92,791 |
| 2020 | 3,834 | 44,45,505 |
| Total | 11,391 | 1,28,57,703 |
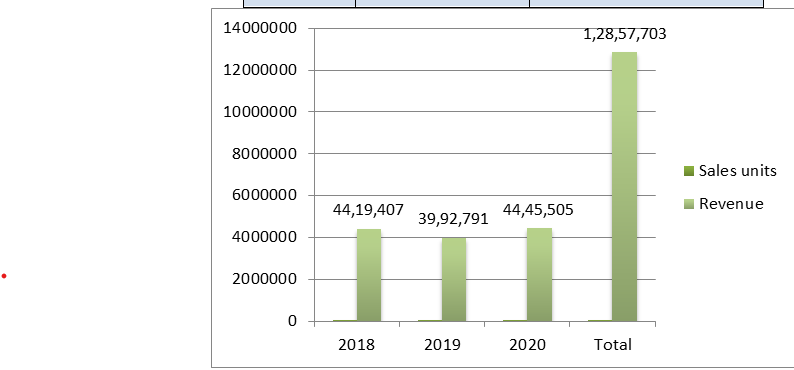
In the case of USA also like U.K. similar trend is seen and in the year 2019 sales decline and in 2020 it again gets increased. This reflects that in the USA market, firms observe good recovery in sales, and maintaining consistency in sales in the USA is a challenging task for the business firm.
In the USA, there is not much difference between sales of 2018 and 2020, and it can be said that perhaps it is the maximum potential up to which firm can stretch its sales in the USA market and this means that firm need to work on additional ways to generate more sales in the business.
| Fiscal year | Sales units | Revenue |
| 2018 | 4,168 | 61,21,066 |
| 2019 | 4,085 | 60,02,612 |
| 2020 | 2,782 | 41,32,431 |
| Total | 11,035 | 1,62,56,109 |
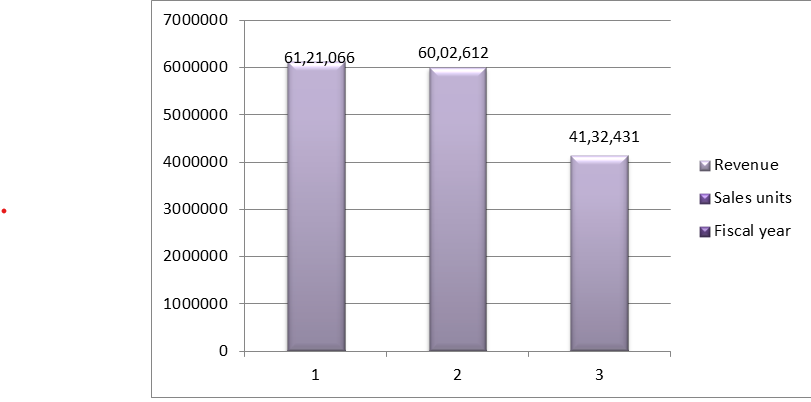
In the case of Japan slight decline was observed in sales in the year 2019, but in the year 2020 sharp decline is observed,, which is a matter of concern and on this front firm needs to pay attention to its performance. BIJ needs to identify the reason behind the sharp decline in sales in the Japanese market.
Benchmark comparison for different categories
Table 4: BIJ category performance
| Year | Month | Particulars | Sales Volume |
| 2020 | May | Bracelet | 278 |
| 2020 | May | Rings | 18 |
| 2020 | May | Necklaces | 22 |
| 2020 | May | Hairbands | 2 |
| 2020 | May | Accessories | 9 |
| Total | 329 |
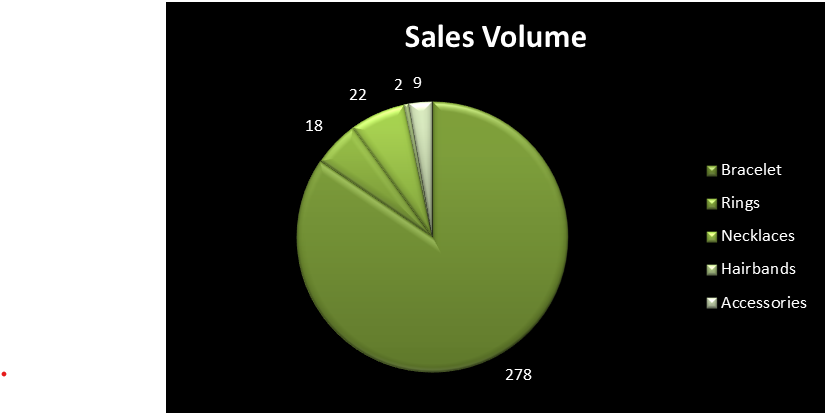
Figure 4: BIJ category performance chart
In the case of bracelet, higher sales is observed and in the case of hairband and accessory same is very low and it can be said that in the case of these two products firm need to pay special attention in terms of performance. In the case of ring and necklace, moderate performance is observed. These statistics reflect that BIJ needs to improve its marketing efforts at a fast pace in order to get good results.
Task 4
Data in chart forms and interpretation
2018
USA
| Year | Nation | Sales units | Revenue |
| 2018 | United States | 3854 | 4419407 |
Chart and interpretation
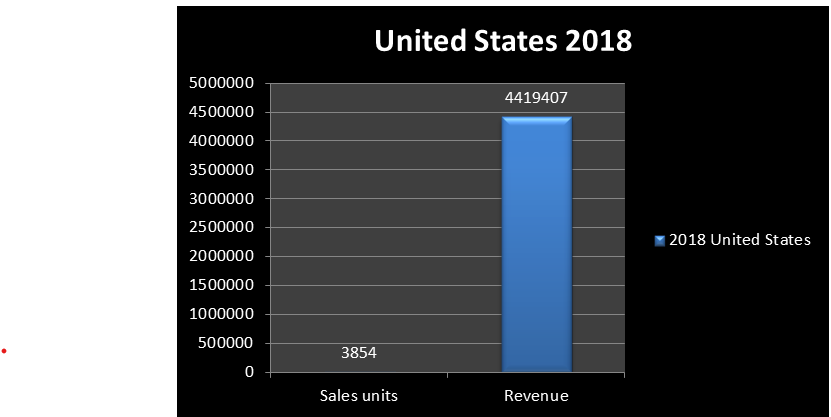
Figure 5: USA performance in the year 2018
| Year | Nation | Units sold | Sales revenue |
| 2018 | United Kingdom | 2,303 | 19,33,006 |
| Year | Nation | Sales units | Revenue |
| 2018 | Japan | 4,168 | 61,21,066 |
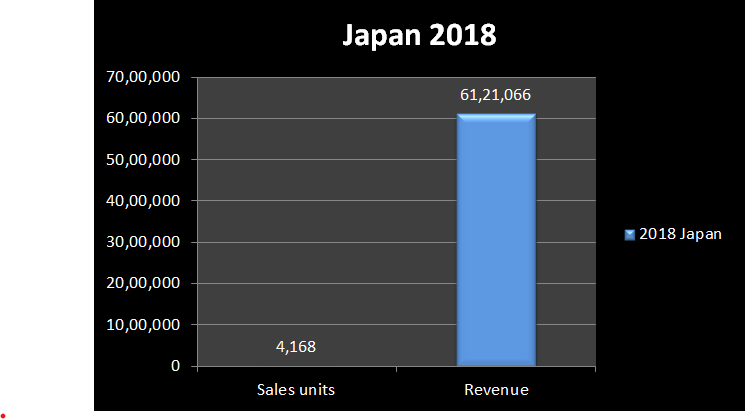
Figure 7: Japan 2018 performance
2019
Table 8: USA sales performance
| Year | Nation | Sales units | Revenue |
| 2019 | United States | 3703 | 3992791 |
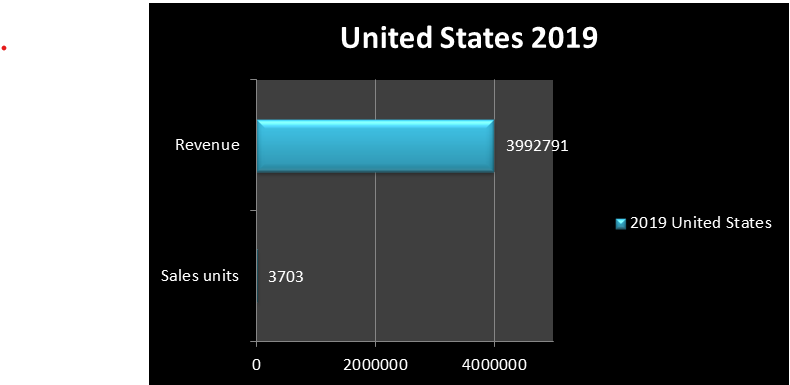
Figure 8: USA 2019 performance
| Year | BIJ Location | Volume of Sales | Value of Sales |
| 2019 | United Kingdom | 2,247 | 17,94,417 |
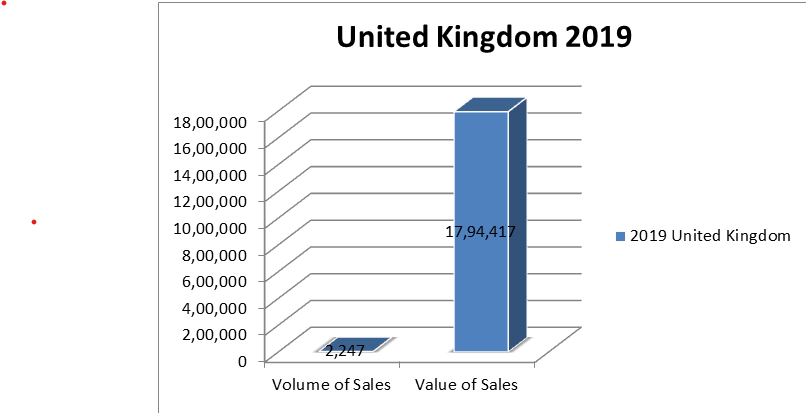
Table 10: Japan 2019 performance
| Year | Nation | Sales units | Sales revenue |
| 2019 | Japan | 4,085 | 60,02,612 |
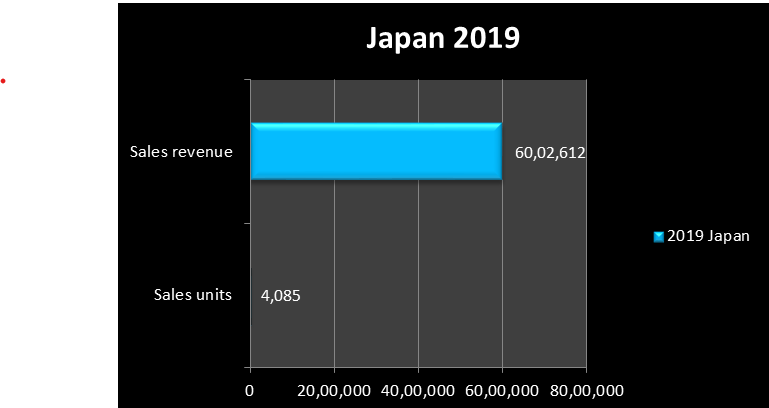
Figure 10: Japan 2019 performance
2020
Table 11: USA 2020 performance
| Year | Nation | Units sold | Revenue |
| 2020 | United States | 3,834 | 44,45,505 |
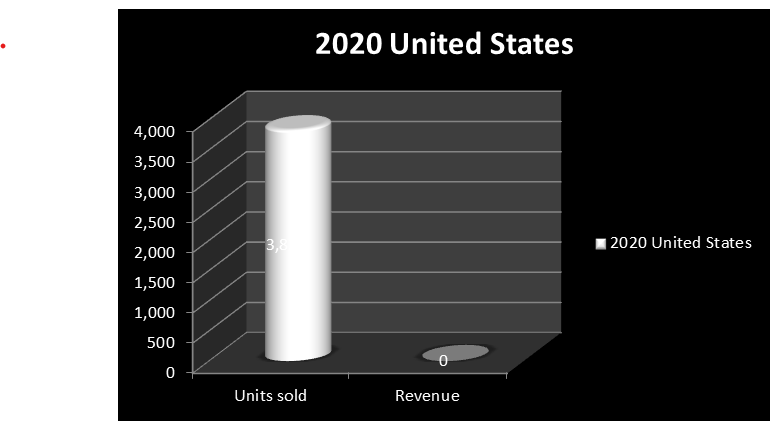
Figure 11: USA 2020 performance
| Year | BIJ Location | Volume of Sales | Value of Sales |
| 2020 | United Kingdom | 2,583 | 22,59,426 |
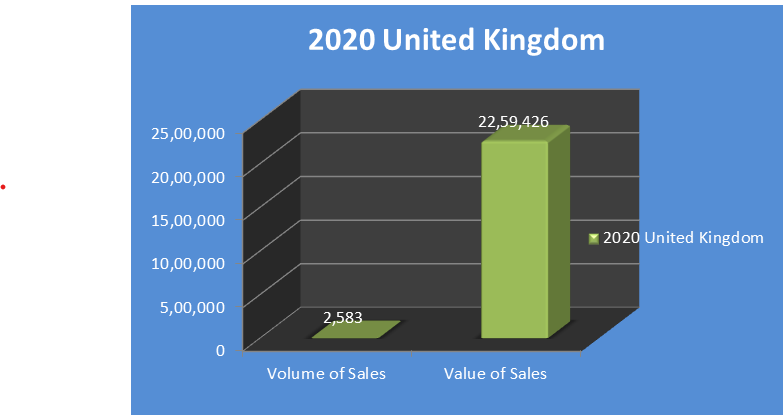
Figure 12: UK 2020 performance
Table 13: Japan 2020 performance
| Year | Nation | Units sold | Revenue |
| 2020 | Japan | 2,782 | 41,32,431 |
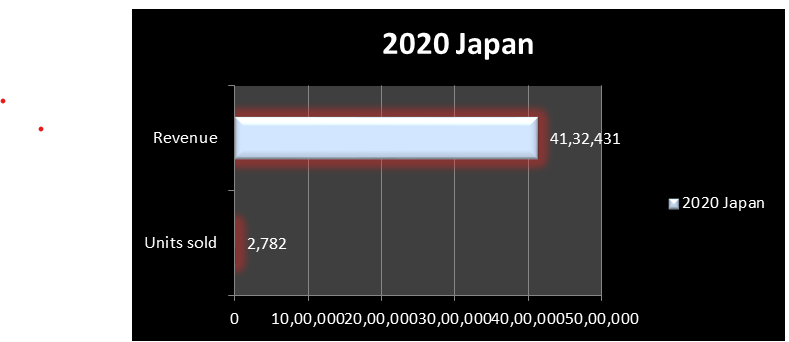
Figure 13: Japan 2020 performance
It can be observed that sales in Japan in the year 2020 will decline significantly which cannot be considered good from a business point of view. However, sales in Japan are still higher than in other nations where the firm is operating its business. It can be observed that a marketing campaign is an effort under which a firm increases its product brand awareness in the market.
By doing aggressive marketing firm tries to generate more sales in its business. In the year 2020, BIJ will observe growth in sales in the U.K. It is expected that this growth will continue as marketing efforts are effective, as evidenced by strong growth in sales.
The marketing campaign of the business firm is concerned with the increase in sales revenue. If the firm improves its marketing efforts in the U.K. market, then it can observe more growth in sales. In the Japanese market, there is also a need to improve marketing campaigns to generate good sales as sales are constantly declining. In this regard, BIJ can think about a wide variety of marketing options, life influencer market or Facebook-based marketing etc to generate good results and constantly observe growth in sales in the business.
Task 5
Conclusion and Recommendations
Based on analysis of data, it is concluded that BIJ gives good sales performance across the USA, U.K., and Japan. Statistics revealed that the mentioned firm is focusing more on a specific product category and ignoring other products completely.
Hence, low sales are observed across varied product lines. Hence, to boost sales, the firm must focus on multiple product lines, and it must also place a lot of emphasis on aggressive marketing in the business. So, BIJ needs to spend more amount of money on marketing its products.
The mentioned firm can collect data regarding customer taste and preference, rivals’ sales, pricing strategies, etc. When more data is available on hand, analysts will be able to evaluate firm performance in a proper manner. In order to improve the impact of the marketing campaign, some recommendations are given below.
- In the business, there must be a feedback system under which the operational team of the BIJ must know the pain points of the customers, and their grievances and all these grievances must be solved as much as possible (Khan and Smith, 2020). http://MSc Management Data Driven Decisions for Business Assignment SampleMore firms will be proactive on this front it will be able to increase customer satisfaction and will develop a loyal customer base in the business.
- In order to make improvement in performance in the sales area firm need to trace the data collected. This tracing of data must not be done only regarding sales but also in respect to varied business operations (CHOI and YANG, 2021).http://MSc Management Data Driven Decisions for Business Assignment Sample This will lead to the elimination of duplication of efforts to clean the data. If data will be structured at the source, it will be ensured that perfect data is used for analysis purposes.
- Marketing campaigns that the business firm runs should have some targets, and the results regarding the marketing campaign must be measured and should be compared with the KPI to evaluate the performance of the marketing campaign. This will assist management in identifying areas where hard work needs to be done to get better results.
- If a marketing campaign proves effective in the U.K., for example, then that effective strategy can be implemented in another nation where the firm is currently operating its business and the marketing campaign is not running (González-Sanguino and al 2019).http://MSc Management Data Driven Decisions for Business Assignment Sample
- It is recommended to the BIJ that in order to get excellent results on the marketing campaign, attention can be paid to the social media marketing, and under this specifically firm can go for influencer marketing. Influencers are product experts or celebrities, and people follow them and listen to them (Nguyen and al. 2020). http://MSc Management Data Driven Decisions for Business Assignment SamplePeople adopt the products recommended by the influencers, and due to this reason, BIJ can go for influencer marketing in its business. Apart from this, a mentioned business firm can also launch a wide variety of ads like image, video-based ads and carousel ads. By launching a wide variety of ads firm will be able to engage with the people ineffective way, and there will be higher ROI on the firm marketing efforts.
- It is recommended that an analytics firm must improve its data analytics infrastructure, and under this, it must clean data at the source must use an advanced big data ETL process. ETL stands for extract, transform and load, under which relevant data is extracted from multiple sources, and then it is transformed using specific tools by the system. In the transform, data cleaning is done, and semi-structured data is converted into structured data that can be used for analysis purposes, and finally, that data is loaded over the source for analysis purposes. By using advanced technology, firm will be able to manage data issues in the business.
REFERENCES
Alston, J.M., (2018). Reflections on agricultural R&D, productivity, and the data constraint: unfinished business, unsettled issues. American Journal of Agricultural Economics, 100(2), pp.392-413.
CHOI, B.N. and YANG, H.C., (2021). A Study on Strategic Ways to Increase Eco-friendly Food Sales Using IPA. The Journal of Economics, Marketing and Management, 9(1), pp.15-24.
Domínguez, E., Pérez, B., Rubio, A.L. and Zapata, M.A., (2019). A taxonomy for key performance indicators management. Computer Standards & Interfaces, 64, pp.24-40.
Flyverbom, M., Deibert, R. and Matten, D., (2019). The governance of digital technology, big data, and the internet: New roles and responsibilities for business. Business & Society, 58(1), pp.3-19.
González-Sanguino, C., Potts, L.C., Milenova, M. and Henderson, C., (2019). Time to Change’s social marketing campaign for a new target population: results from 2017 to 2019. BMC psychiatry, 19(1), pp.1-11.
Hariri, R.H., Fredericks, E.M. and Bowers, K.M., (2019). Uncertainty in big data analytics: survey, opportunities, and challenges. Journal of Big Data, 6(1), pp.1-16.
Iqbal, M., Kazmi, S.H.A., Manzoor, A., Soomrani, A.R., Butt, S.H. and Shaikh, K.A., (2018), March. A study of big data for business growth in SMEs: Opportunities & challenges. In 2018 International conference on computing, mathematics and engineering technologies (iCoMET) (pp. 1-7). IEEE.
Khan, M.A. and Smith, J.E.M., (2020). “Covibesity,” a new pandemic. Obesity Medicine, 19, p.100282.
Nguyen, H.D., Nguyen, K.V., Hoang, S.N. and Huynh, T., (2020), December. Design a management system for the influencer marketing campaign on social network. In International Conference on Computational Data and Social Networks (pp. 139-151). Springer, Cham.
Raut, R.D., Mangla, S.K., Narwane, V.S., Gardas, B.B., Priyadarshinee, P. and Narkhede, B.E.,
(2019). Linking big data analytics and operational sustainability practices for sustainable business management. Journal of cleaner production, 224, pp.10-24.
Runkler, T.A., (2020). Data analytics. Springer Fachmedien Wiesbaden.
Vicario, G. and Coleman, S., (2020). A review of data science in business and industry and a future view. Applied Stochastic Models in Business and Industry, 36(1), pp.6-18.
Wani, M.A. and Jabin, S., (2018). Big data: issues, challenges, and techniques in business intelligence. In Big data analytics (pp. 613-628). Springer, Singapore.
