MSc Management Data Driven Decisions for Business Assignment Sample 2023
Task one: Introduction and project planning
In the era of digitalisation and dynamic market situation, companies want to expand their business globally and seek highly competitive advantages. Customers’ demands and expectations often change which completely changes the market scenario. In a such dynamic situation, companies have to be hyperactive and address market trends by using market data.
Data is the key to high profitability, competitiveness, and sustainability (Himanen et. al. 2019). Multinational companies’ decisions are more aligned with data than national companies’ as they have an idea about market conditions. Global companies use market data in their decision-making process, identify customer preferences, determine expansion plans, and other investment decisions based on market data.
However, all companies do not have the expertise to collect and analyse market data to use in the strategy-making process, and thus, they hire consulting firms or outsource specific areas of the data analytics process.

The present report is based on market data analysation of Bangles International Jewellery. It is an international company that seeks to increase its competitiveness and compete with giants in their industry like LVMH, Cartier, Signet, and others companies (Shrestha et. al. 2019). However, the company operates in North America, Europe, and Asia but they want to establish its business in Africa, Australia, and South America.
Other than that, the company uses distribution networks and they have some outlets in Mumbai, New York, and London. They also leverage concessions in some major airport hubs. Although these efforts are not sufficient to achieve their globalisation goals and thus, in May 2020, they invest in UK marketing campaigns to increase their sales.
For that purpose, they hire Wood from The Trees (WFTT) data consulting firms. It is well- an established firm with a good brand image and operates with some famous international companies. WFTT recruit less experienced employee and train them according to the project requirements and assign projects as per their competencies and expertise by assessing them to allow working with different projects and areas (Mehrabi et. al. 2021).
Thus, the data analyst of the company is well-trained and has expert knowledge. For the BIJ project, they deploy expert analysts along with some interns for training purposes.
The present report includes data analysis and charting process of BIJ sales data along with comparative data from the US and Japan’s market sales and category performance data. Moreover, the project plan, project management framework, and BIJ key performance index evaluation are also given in the report.
1.1 Aim of this report
The primary aim of this project is to identify the effectiveness of BIJ’s investment in the marketing campaign in the UK by assessing sale performance. BIJ wants to establish its global presence and thus, they invest in the potential market which is the UK. They hire WFTT to conduct market analysation and provide the assessment of their investment (Yang et. al. 2019).
The report aims to critically analyse the evolving usability of data to attend to business problems and give logical justification based on the market data and its analysation outcome. WFTT compares UK’s 2018-2020 sales to fulfil the purpose of this report. Another motive is to explore the data analytical method which is mostly used in the organisation and take advantage of market data by applying effective analysation methods.
The report includes the assessment of data quality issues as well as presents its remedies. The report critically presents the data in the context of BIJ in the form of tables and charts to provide a clear understanding to BIJ about their investment result (Labadie et. al. 2020). Lastly, the aim of this report is to evaluate various business analytical methods for planning and implementing purposes.
1.2 Project plan
WFTT makes a systematic project plan and presents it to BIJ for their approval. WFTT presents some strategies and plans that enable to use of data analytical practices and the consulting company asks for feedback from BIJ in order to remove chances of error and any kind of gaps. They plan to compare UK sales from the last two years sales in order to identify the potential of the market, and customer behaviours or demands.
They also analyse category performances to assess which products are most demanded and which products seek more attention. Thus, they choose high contributors’ products of BIJ including, bracelets, necklaces, rings, hair bands, and accessories (Duan et. al. 2019). The data analyst compares these products’ sales data from 2018-2020 to get more understanding of UK sales performances.
After that, they took the most potential operating market of BIJ which is Japan and the US, and compare their sales from the UK sales to assess the impact of the marketing campaign and the UK sales performances. Moreover, a comparative analysis of three markets’ sales data enables the analyst to understand the pattern of the sales and common factors in all three markets. They plan to present this comparative analysis in table and chart form for easy understanding and precise presentation of their data analysation process.
1.3 Data analytic framework
WFTT uses the best-suited data analytics framework as per the requirements of its clients. Data analytic frameworks allow the analytic to optimistically use the tools to get valuable input and apply them to meet their purposes (Urbinati et. al. 2019). WFTT uses MS Excel to manage the collected data as the formulas enable it to arrange in systematic order and analyse to get inputs for interpretation.
Moreover, Excel allows the presentation of the data in table and chart form which is easier to understand and get knowledge about the situation. WFTT identifies some project management frameworks like WBS, KANBAN, DSDM, PRINCE2, PERT, Scrum, and other agile methods.
From these frameworks, Work Breakdown Structure (WBS) is used which enables the division of entire operations into small chunks which are easy to accomplish, manage, and control (Raut et. al. 2019). WFTT divides project work into small parts, for example, collecting data from secondary sources, pour into Excel sheets, analysing them by using suitable formulas and preparing tables or charts to present in an informative way.
1.4 Key Performance Indicators
Key performance indicators (KPIs) are the indication of the company’s success or failure and the reason behind the situation. Multinational companies use several KPIs as per their industry size, type of market areas, and business strategies (Chakraborty and Ghosh, 2020).
KPIs are very useful for the stakeholders of the company from which they determine whether to remain with the company or not. Regarding the BIJ project, WFTT takes some KPIs to identify their business practices and their performance and associate with their investment effect on sales performances.
Marketing practices: WFTT first analyse the marketing practices of BIJ because the purpose of this project is to identify the impact of the marketing campaign on sales. They analyse BIJ’s marketing strategies and found that it is interactive, effective, customer-engaging, and market-oriented. However, they found that BIJ mainly focuses on hard sales rather than customer satisfaction (Liu et. al. 2019).
Other than that, WFTT assesses market budgets, spending, influential marketing performance, affiliated marketing strategies, website engagement rate, bounce rate, lead generation practices, conversion rate, customer engagement approach, and retention policies of the company. BIJ spends a high budget on its marketing campaigns and considers the importance of marketing in its overall success.
Profit generation: WFTT identify the profit generation approach of BIJ whether they generate high-margin profit or focus on customer retention. They found that BIJ mainly focuses on profit maximisation rather than customer retention. Thus, they can generate high revenue which they identify by auditing their sales, reserve fund, revenues, net or gross profit margin, credit score, and investments or returns (Saiz-Rubio and Rovira-Más, 2020). Moreover, the sales trends exhibit their profitability and the strong position of the company.
Customer retention and satisfaction: BIJ successfully generate high-margin profit but regarding customer retention and satisfaction, they are not doing well. Customer satisfaction is the most usable KPI to analyse the sustainability and competitiveness of the company.
BIJ majorly focus on high profitability as they charge high prices to earn high margin profit, hence, the customer can buy only one time from the company (Duan et. al. 2020). Thus, BIJ should focus on customer retention by lowering its product price in order to generate sustainable profit instead of high profit.
Task 2: Data quality issues and remedies
WFTT is a recognised data consulting firm where they daily deal with bulky data and involves in its analysation process. However, they also face different types of data quality issues while collecting, arranging, analysing, interpreting, and implementing the data in actual application. Hence, data analysis is a complicated and lengthy process where the high scope of error and gaps adversely affect the quality of data which may ruin their market image (Tura et. al. 2019).
A data analyst can add value by keeping the data quality high and ensure that they deliver the best quality work by eliminating all scope of errors in the data they used for the analysation purpose. Data analyst job is critical as they have to work precisely and puts comparatively more effort in analysation process. WFTT maintains data quality but also, but faces some data quality issues while dealing with BIJ’s sales and category performance data. The following are provided some data quality issues and their appropriate remedies:
Repetition: WFTT’s data analyst finds issues due to duplicate and repeated data as most of the sites contain similar kinds of data and the analyst collect and arrange them into the sheet. But it realises at the time of analysation that similar data is present in many line items (Bibri, 2021). Thus, it consumes a lot of time and effort to find correct data and remove other data. However, the data analyst collects BIJ sales data from their report and annual report but due to multiple files and three years of reports, there are some duplicate entries that create problems.
Remedies: There are some tools that enable to find of duplicate and repeat data from the large data set. Moreover, at the time of entry, the analyst should cautious about their repetition.
Lack of consistency in format and language: BIJ gives all three markets sales data where the US and the UK data can be understood but Japan sales data is difficult to understand due to different languages and formats (Araujo et. al. 2020). Hence, the analyst finds problems to understand Japan’s sales data which also increases the chances of errors.
Remedies: The analyst should demand the same language and pattern report from BIJ as it is easy for them to arrange through their internal sources. Moreover, the analyst should use the annual report of BIJ which is in the same language and format (Black, 2019). Additionally, they should also use the same format to collect, analyse, and interpret the data which helps to maintain consistency and provide easy understanding.
Task three: Data analysis and commentary
Data analysation of UK, US, and Japan sales along with category performance data are present in this section under different subheadings. The all-numerical values are in Euros.
Table A: UK sales volume and value
| UK market | Sale Volume | Sale Value |
| 2020 | 2583 | 22,59,426 |
| 2019 | 2247 | 17,94,417 |
| 2018 | 2303 | 19,33,006 |
Table 1: Sales value and volume of the UK sales
- Table 1 shows that in 2018, sales volume was 2303.
- In 2019, it decreases by 2247 and increase in 2020 by 2583.
- The analyse identify the reason for sales ups and down and they found that due to Brexit, the sales decrease in 2019 but increases in 2020 as till then, business get knowledge about market conditions.
- However, such fluctuation shows that there is potential in the UK market and BIJ should continuously invest in the market campaigns.
Table B: Comparison of category performance
| 2018 | Accessories | Bracelets | Rings | Hair Bands | Necklaces | Total |
| Sales Value | 74228.81
|
2126238.22
|
1019179.07
|
10171780.57
|
1143112.41
|
5434539.09 |
| Sales Volume | 48 | 1370 | 699 | 713 | 802 | 3632 |
| 2019 | Accessories | Bracelets | Rings | Hair Bands | Necklaces | Total |
| Sales Value | 15499
|
1135204
|
262399
|
86874.93
|
256576.3
|
1756553.18 |
| Sales Volume | 11 | 1370
|
699 | 713 | 430 | 3632 |
| 2020 | Accessories | Bracelets | Rings | Hair Bands | Necklaces | Total |
| Sales Value | 144828
|
1674952
|
133415
|
28442.11
|
189190.4
|
2170827.52 |
| Sales Volume | 100 | 2078 | 204 | 35 | 166 | 2583 |
Table 2: Comparison of category performance
- Table 2 shows that bracelets are performing well on average for three years followed by necklaces and rings.
- In 2018 and 2019 sales volume is similar which decrease in 2020 by 1049 and reaching 2583.
- The analyst identifies the reason for to decrease in sales in 2020 and they found that it may due to the Covid-19 pandemic outbreak. However, it is not the only reason for low sales but one of the reasons.
- Hair Bands and accessories are not performing well on average for three years and thus, BIJ should encourage their target audience to increase these product sales.
Table C: Compare three markets’ data
| 2018 | 2019 | 2020 | ||
| UK | Sales Value | 19,33,006 | 17,94,417 | 22,59,426 |
| Sales Volume | 2303 | 2247 | 2,583 | |
| Japan | Sales Value | 55,23,023 | 55,23,906 | 38,32,782 |
| Sales Volume | 3758 | 3,781 | 2,567 | |
| USA | Sales Value | 44,19,407 | 39,92,791 | 41,09,562 |
| Sales Volume | 3854 | 3703 | 3834 | |
Table 3: Sales value and volume comparison
- UK sales data interpret in table A.
- Regarding Japan sales, it constantly decreases since 2018. However, it increases in 2019 from 23 Euros which is not considerable (Gupta al. 2019).
- US sales data shows a similar pattern to UK sales data where in 2018 sales were 3854, which decrease by 3703 in 2019 and increase by 3834 in 2020.
- However, the analyst could not identify a solid reason behind such fluctuation but they summarise that the marketing campaign implications show in the sales performance of all three markets.
Task four: Data charting and commentary
Chart A: Compare sales volume across three markets
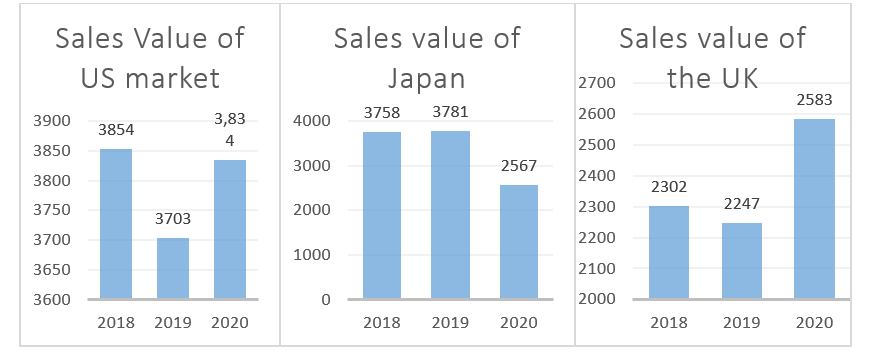
Chart A: Sales value of the US, Japan, and the UK respectively
- Chart A shows US sales fluctuation from the last three years.
- Japan’s sales value constantly decreases, however, not with a huge difference but it shows low market potential.
- UK sales value replicates US value but the main difference is the amount of value which is high in the US.
- The sales value of the three markets shows that BIJ should continuously invest in the UK because Japan market has little potential, and the US market reached its potential level (Abdel‐Basset al. 2019). Hence, the UK market has the scope to grow.
Chart B: Compare category performance
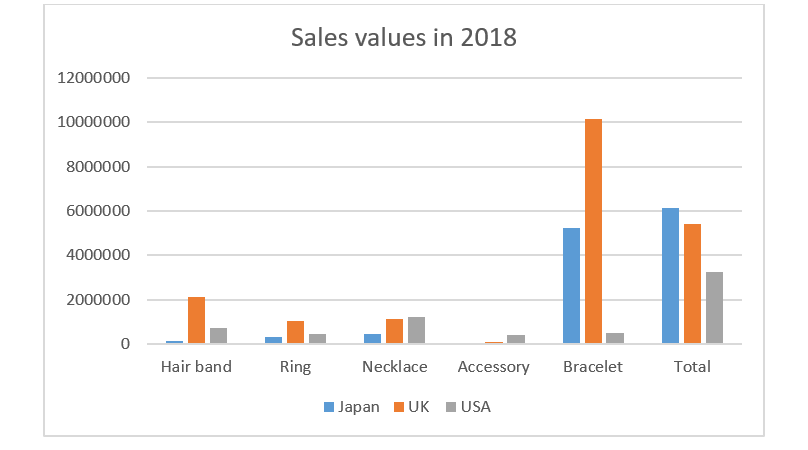
Sales value of three markets in 2018
- Bracelets sales are high across the three markets.
- Accessories sales are nil and hair band or rings also not performing well.
- BIJ should focus on low contributors’ products to acquire the market with high intensity.
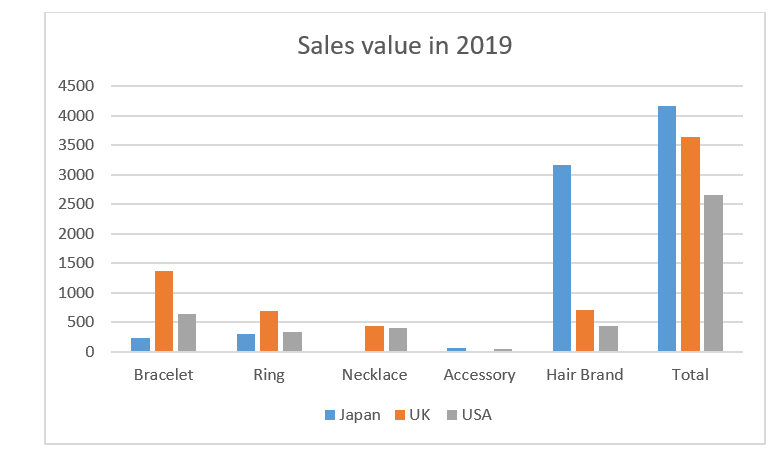
Sales value of three markets in 2019
- Hair band sales are high in Japan but low in other countries.
- In the UK, bracelets sales are high but in the US all product average perform except accessories.
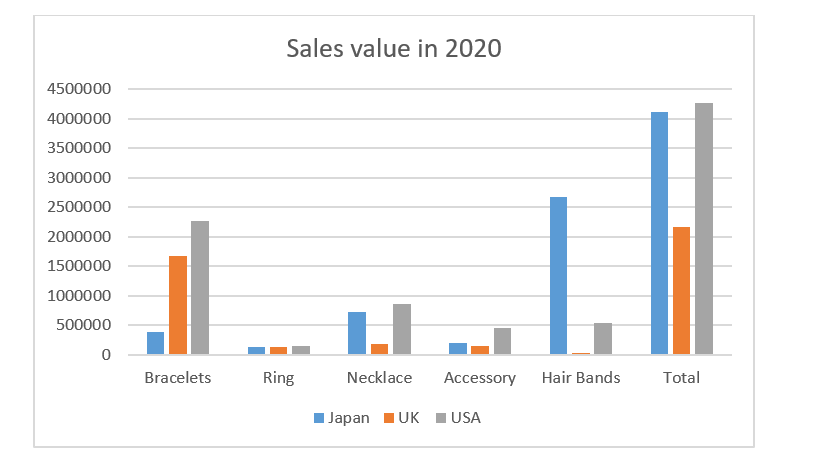
Sales value of three markets in 2020
- In Japan only hair bands’ performance is high but bracelets are a low performance.
- While in the UK and the US, bracelet performance is high and another product performance is satisfactory.
Chart C: Marketing campaign impact in three markets
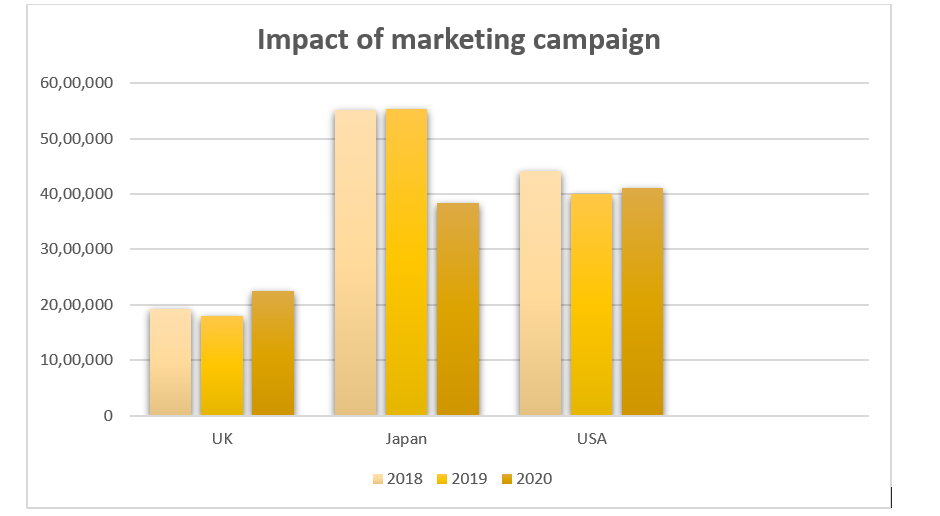
Chart C: Impact of marketing campaign across three markets
- Chart C shows that Japan is highly influenced by the marketing campaign but the impact is not long-lasting which shows by its decreasing sales.
- US and UK markets similarly affect the marketing campaign but the US has more impact than the UK concerning value.
- BIJ should continuously invest in the UK to achieve its objectives and leverage the potential of the market.
Task five: Conclusion
The present report concluded that data analysation is a vital process to assess the implications of business operations. BIJ use WFTT’s data consulting services to identify the implications of their marketing campaign investments on the UK sales performance. WFTT conducts a comparative analysis of UK sales from the last two years, a category performance analysis, and compares UK sales from Japan and US to identify the pattern of sales and the impact of a marketing campaign. As per the WFTT analysation, it can conclude that BIJ should invest in the UK market because there is potential to grow as compared to US and Japan.
5.1 Recommendations
- BIJ should use digital marketing techniques to influence the target audience (Cheng al. 2020).
- They should improve their marketing campaign by adding hair bands and accessories products in order to improve their sales.
5.2 Action plan
BIJ should use advanced data analysation and collection processes that enable it to provide market insights and customer preferences (Deterding, 2019). Thus, they can make improved campaigns and achieve their goals more effectively. They should also focus on customer retention and satisfaction rather than profit maximisation to gain sustainable competitive advantages.
References
Abdel‐Basset, M., Manogaran, G., Mohamed, M. and Rushdy, E., (2019). Internet of things in smart education environment: Supportive framework in the decision‐making process. Concurrency and Computation: Practice and Experience, 31(10), p.e4515.
Araujo, T., Helberger, N., Kruikemeier, S. and De Vreese, C.H., (2020). In AI we trust? Perceptions about automated decision-making by artificial intelligence. AI & SOCIETY, 35(3), pp.611-623.
Bibri, S.E., (2021). Data-driven smart sustainable urbanism: the intertwined societal factors underlying its materialization, success, expansion, and evolution. GeoJournal, 86(1), pp.43-68.
Black, K., (2019). Business statistics: for contemporary decision making. John Wiley & Sons.
Chakraborty, T. and Ghosh, I., (2020). Real-time forecasts and risk assessment of novel coronavirus (COVID-19) cases: A data-driven analysis. Chaos, Solitons & Fractals, 135, p.109850.
Cheng, J.C., Chen, W., Chen, K. and Wang, Q., (2020). A data-driven predictive maintenance planning framework for MEP components based on BIM and IoT using machine learning algorithms. Automation in Construction, 112, p.103087.
Deterding, S., (2019). Gamification in management: Between choice architecture and humanistic design. Journal of Management Inquiry, 28(2), pp.131-136.
Duan, Y., Cao, G. and Edwards, J.S., (2020). Understanding the impact of business analytics on innovation. European Journal of Operational Research, 281(3), pp.673-686.
Duan, Y., Edwards, J.S. and Dwivedi, Y.K., (2019). Artificial intelligence for decision making in the era of Big Data–evolution, challenges and research agenda. International journal of information management, 48, pp.63-71.
Gupta, S., Chen, H., Hazen, B.T., Kaur, S. and Gonzalez, E.D.S., (2019). Circular economy and big data analytics: A stakeholder perspective. Technological Forecasting and Social Change, 144, pp.466-474.
Himanen, L., Geurts, A., Foster, A.S. and Rinke, P., (2019). Data‐driven materials science: status, challenges, and perspectives. Advanced Science, 6(21), p.1900808.
Labadie, C., Legner, C., Eurich, M. and Fadler, M., (2020), June. Fair enough? Enhancing the usage of enterprise data with data catalogs. In 2020 IEEE 22nd Conference on Business Informatics (CBI) (Vol. 1, pp. 201-210). IEEE.
Liu, F., Chen, Y.W., Yang, J.B., Xu, D.L. and Liu, W., (2019). Solving multiple-criteria R&D project selection problems with a data-driven evidential reasoning rule. International Journal of Project Management, 37(1), pp.87-97.
Mehrabi, Z., McDowell, M.J., Ricciardi, V., Levers, C., Martinez, J.D., Mehrabi, N., Wittman, H., Ramankutty, N. and Jarvis, A., (2021). The global divide in data-driven farming. Nature Sustainability, 4(2), pp.154-160.
Raut, R.D., Mangla, S.K., Narwane, V.S., Gardas, B.B., Priyadarshinee, P. and Narkhede, B.E., (2019). Linking big data analytics and operational sustainability practices for sustainable business management. Journal of cleaner production, 224, pp.10-24.
Saiz-Rubio, V. and Rovira-Más, F., (2020). From smart farming towards agriculture 5.0: A review on crop data management. Agronomy, 10(2), p.207.
Shrestha, Y.R., Ben-Menahem, S.M. and Von Krogh, G., (2019). Organizational decision-making structures in the age of artificial intelligence. California Management Review, 61(4), pp.66-83.
Tura, N., Hanski, J., Ahola, T., Ståhle, M., Piiparinen, S. and Valkokari, P., (2019). Unlocking circular business: A framework of barriers and drivers. Journal of cleaner production, 212, pp.90-98.
Urbinati, A., Bogers, M., Chiesa, V. and Frattini, F., (2019). Creating and capturing value from Big Data: A multiple-case study analysis of provider companies. Technovation, 84, pp.21-36.
Yang, Q., Steinfeld, A. and Zimmerman, J., (2019), May. Unremarkable ai: Fitting intelligent decision support into critical, clinical decision-making processes. In Proceedings of the 2019 CHI Conference on Human Factors in Computing Systems (pp. 1-11).
