PGBM01 Financial Management and Control Sample
Part 1
1. Question 1
(A) Horizontal analysis for years 2015-2018
| AEKI plc | ||||
| Year | 2015 | 2016 | 2017 | 2018 |
| Sales (£000s) | 14,945 | 16,650 | 18,900 | 22,700 |
| Trend % | 0.00% | 11.41% | 26.46% | 51.89% |
| Cost of Sales (£000s) | 10460 | 12,050 | 14,175 | 17,800 |
| Trend % | 0.00% | 15.20% | 35.52% | 70.17% |
| Gross profit (£000s) | 4,485 | 4,600 | 4,725 | 4,900 |
| Trend % | 0.00% | 2.56% | 5.35% | 9.25% |
| Net Profit (£000s) | 1,260 | 960 | 896 | 800 |
| Trend % | 0.00% | -23.81% | -28.89% | -36.51% |
| Long-term capital employed (£000s) | 11,870 | 12,030 | 12,726 | 12,726 |
| Trend % | 0.00% | 1.35% | 7.21% | 7.21% |
| Workings | ||||
| Total Assets | 12,780 | 13,350 | 14,530 | 15,320 |
| Current Liabilities | 910 | 1,320 | 1,804 | 2,594 |
| Capital employed | 11,870 | 12,030 | 12,726 | 12,726 |
Table 1: Horizontal analysis
(Source: Case study)
The study has covered the horizontal analysis of sales revenue and the cost of sales for AEKI plc to get the change in percentages throughout the year. Based on this study, the base year is 2015, and it has shown in the study to get the change in percentages in finance.

The study has discussed the horizontal analysis for AEKI plc to check their financial changes in the past few years. As per the view of Maassen, (2019), the horizontal analysis for an organisation is more important to get the proper result of financial analysis throughout the year. It has shown that the horizontal analysis for sales has increased in the past few years.
Therefore, it has stated that the overall sales revenue is higher in the year of 2018 as compared to the 2015 where it has increased the value of sales trend analysis for AEKI plc.
It has been notified by this study that the cost of sales and the gross profit for the current year has also increased. Therefore, their growth rapidly increased in the year of 2018 as compared to the last few years where their financial analysis was not as good as 2018.
The company’s net profit has decreased which has shown in the study as well as the long-term capital employed. The employment remains the same for the last few years then it has decreased in the year of 2018 (case study).
(B) Ratios for years 2015-2018
Profitability Ratio
The study has notified the profitability ratio which can be classified into two ratios which are gross profit ratio and operating profit ratio. As argued by Hussain et al. (2018), the gross profit ratio analysis is more important for an organisation where they can get the proper result of their strategy to growth for the future year.
However, the operating margin also helps organisations to get the proper result of financial performance for the few years to compare. The study has measured the gross profit and operating ratio for AEKI plc to get their financial performance in the last four years.
It has shown that the gross profit of AEKI plc has decreased continuously where the value was 30.01 in 2015 then the value decreased to 21.59 in 2018. The operating margin ratio has also been measured by this study where the operating margin of AEKI plc was 9.87 in 2015 where the value decreased to 4.41 in 2018 which was lower than the previous year (case study).
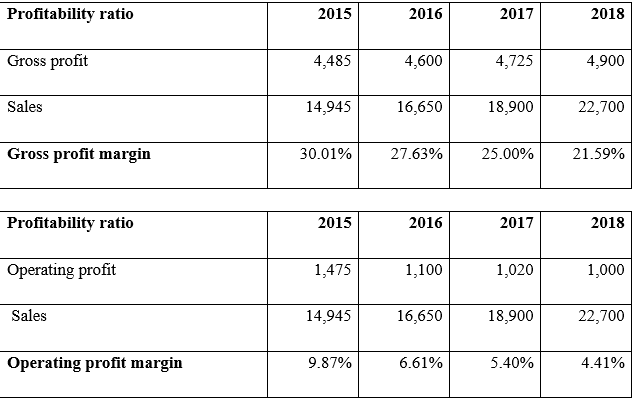
Table 2: Profitability ratio
(Source: Case study)
Efficiency Ratio
Based on this study the efficiency ratio for AEKI plc was stable in the last four years as their account receivable as well as the account payable ratio was quite amazing in the last four years. As argued by Mayakonda et al. (2018), the account payable ratio and receivable ratio for both the company faced a lower number of days which have made them a good financial analysis through the last few years.
The account receivable ratio for AEKI plc was 11 in 2015 where the number has decreased to 8 in 2018 which was stable as compared to 2015. The account payable ratio for the company was 11.49 in 2015 and it has decreased to 9.27 in 2018 (case study).
| Efficiency ratio | 2015 | 2016 | 2017 | 2018 |
| Sales | 14,945 | 16,650 | 18,900 | 22,700 |
| Account Receivable | 1,350 | 1,800 | 2,310 | 3,000 |
| Account Receivable Ratio | 11.1 | 9.3 | 8.2 | 7.6 |
| Efficiency ratio | 2015 | 2016 | 2017 | 2018 |
| Cost of Sales | 10,460 | 12,050 | 14,175 | 17,800 |
| Account Payable | 910 | 1,320 | 1,600 | 1,920 |
| Account Payable Ratio | 11.49 | 9.13 | 8.86 | 9.27 |
Table 3: Efficiency ratio
(Source: Case study)
Liquidity Ratio
The liquidity ratio for AEKI plc has been measured by two ratios which are the current ratio as well as the quick ratio. The study has shown the current ratio for AEKI plc was good in 2017 which was 2.79 which was greater than the value of 2018 which was 2.47. A good current ratio should vary 1.2 to 2. The quick ratio for AEKI plc was also stable as their ratio in 2015 was 2.07. Thus, it has decreased to 1.16 in the year of 2018 which was also stable however not as good as 2015 where the company faced a higher value of quick ratio (case study).
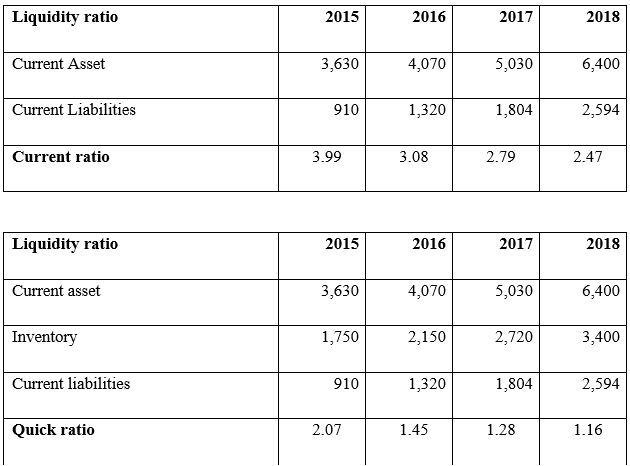
Table 4: Liquidity ratio
(Source: Case study)
Gearing Ratio
The gearing ratio is classified into two ratios in this study which are debt to equity ratio as well as the equity ratio. As argued by Elamer et al. (2018), The debt-to-equity ratio has to be lower than 1 which is good for an organization. Whereas the study has shown that the debt-to-equity ratio was stable for the last four years. The value which has been measured by the study was 0.08 in the year of 2015 as it has slightly increased to 0.21 in 2018 which was also stable for the company (case study).
The higher equity ratio can determine the greater solvency for an organisation which can make them better position in the market. The study has shown the value of equity ratio for AEKI plc was stable for the last four years.
| Gearing ratio | 2015 | 2016 | 2017 | 2018 |
| Total Liabilities | 910 | 1,320 | 1,804 | 2,594 |
| Total shareholders’ equity | 11,870 | 12,030 | 12,126 | 12,126 |
| Debt to equity ratio | 0.08 | 0.11 | 0.15 | 0.21 |
| Gearing ratio | 2015 | 2016 | 2017 | 2018 |
| Total equity | 11,870 | 12,030 | 12,126 | 12,126 |
| Total Asset | 12780 | 13,350 | 14,530 | 15,320 |
| Equity ratio | 0.93 | 0.90 | 0.83 | 0.79 |
Table 5: Gearing ratio
(Source: Case study)
2. Question 2
(A) Discussion and analysis
i) Analysis of the performance and position of AEKI plc
Susan had been forced to retire due to severe illness and she made her son, John to maintain the AEKI plc. Although John does not have enough knowledge about business, he has to control the entire system. After gathering the knowledge about an increment of competitive pressure he consulted with the board of directors of the company. The non-financial performance was not effective at the initial stage when John was taking the duty to maintain the entire system. However, taking several initiatives he is able to manage the difficulties and AEKI plc has reached a certain level in the business market.
On the other hand, it can be argued that John does not have the same ability as his mother Susan to cover up the entire business organization in a single hand. AEKI plc has focused on the increment of sales and John ordered to meet several sales targets to improve the financial performance.
The sales amount has been increased from £14945 to £16650 between 2015-2016, the expenses related to sales also increased around 15% between 2015-2016. The consultants help John by providing several important ideas, about business expansion and proper development of AEKI plc.
Due to a lack of financial support the company has failed to expand their business and is also unable to fulfil the demand of regular consumers (Pattiasina et al. 2018). The company was able to maintain a certain position in the business market of the UK in the period of 2016 to 2018. However, after that, the company has failed to sustain the position in the market.
ii) Description and interpretation of trends and ratios
John has been given the duty to maintain the entire company and also develop and improve the sales and trends of the company. John took initiatives to increase the size of sales, however, the profit did not increase with the enlargement of the sales.
From the ratio analysis, it can be stated that the sales were £14945 in 2015, due to effective initiatives it has increased to £22700 in 2018. However, the gross profit has not increased with the enlargement of sales, therefore, the gross profit margin has decreased gradually which is bad for the company (Fathony, Khaq and Endri, 2020).
Practically the same impact has fallen on the operating profit margin, due to this company having faced several issues. The liquidity ratio is also down going from the year 2015 to 2018, although it is more or less stable.
The AEKI plc is unable to increase their efficiency ratio, they are unable to upgrade their account receivable and payable power with respect to sales. AEKI plc is able to upgrade their sales amount almost 1.5 times, in 2015 it was £14945 and it increased more than 50% to £22700 in 2018. The higher authority has increased the cost of sales by 70% higher from 2015 to 2018. Due to the slow increment of profit, the net profit percentage has been reduced to 37% in 2018 and the company has to reduce almost 50% of sales in the upcoming year.
iii) Major changes in four years
Due to changes in higher authority the AEKI plc company has faced several changes in the four years. They were in a sustained position when Susan was maintaining the duty to cover entire systems (Kartadjumena and Rodgers, 2019).
However, due to several problems and a lack of knowledge about business organization, John was unable to step up the company. The consultants have argued that the company should be in a more developed position after 2015 and the new chairperson has taken initiatives to upgrade the sales amount and sales size. Although the sales amount and the cost has been stepped up, the net profit percentage did not improve and the overall profit reduced to 37% in 2018.
The efficiency of the AEKI plc has declined in 2018 from the initial stage of 2015. The company has faced several difficulties due to a lack of financial support for the first time as the profit percentage has shrunk. The sales amount has been increased from £14945 to £16650 between 2015-2016, the expenses related to sales also increased around 15% between 2015-2016. On the other hand, before 2015, Susan was focused on the entire development of the company. Besides that, she was the biggest shareholder in the company and handled every problem wisely. These major changes occurred four years after the retirement of Susan.
iv) Questions and findings
As per the above ratio and trends analysis, it can be stated that the company is falling down from their sustained position due to a deficiency of proper knowledge about business development. Moreover, the AEKI plc has shrunk due to less financial support as they exceeded the policies of agreement several times.
The main question that can be framed from this that the figure of AEKI plc reflects on the sustainability of business financial performance. Based on the analysis of the financial performance of this company, it can be stated that the recent changes have badly impacted the profitability, liquidity and efficiency condition. Moreover, the risk of the business in regards to a capital structure is gradually increasing.
(B) Advices
The new chairperson after Susan, John is unable to step up their company due to several issues. He has to address those issues immediately and again improve the company to step forward in the direction of financial increment of AEKI plc.
i) Specific advice to address immediate problems
- John should focus on the increment of profit as well as the enlargement of sales amount, as the profit is important to keep financial stability properly.
- Focusing on ratio analysis, the new chairperson of the company is advised to make improvement in the liquidity aspects.
- John and the entire consultants should keep an eye on the business efficiency condition.
3. Question 3
i Examination of offers
John has made several offers to Hedgehog Ltd such as it has initially helped Hedgehog Ltd by providing 100,000 shares. After that later as per the favour John expected that Hedgehog Ltd will pay the shares by paying £8. The senior directors of Hedgehog Ltd have made a decision of accepting the proposal of John. As per the view of Melamed (2018), the company Hedgehog has promoted the downstream targets of gene pathways.
The offer made by John was appropriate for the company Hedgehog Ltd. as it was helping the company in managing the finance of the company. After that John had decided to point out several businesses that are of similar types. The pointed-out businesses were of some companies that we’re engaged with the London Stock Exchange. John has set up private meetings with the director of Hedgehog Ltd during which they have prepared plans for making expansion in the funds.
ii. Discussion on acceptance of offers
The new chairperson of AEKI plc, John has proposed an offer to Hedgehog company that he will give around one lakh shares to the company and Hedgehog Ltd will provide £8 on every share. Hedgehog ltd should accept this offer as it is beneficial for them and the AEKI plc has proposed this offer in an unavoidable situation (Hussain, Rigoni and Cavezzali, 2018). They are willing to make a stable financial situation with the help of that agreement and able to achieve the lost position in the market.
iii. Justification
The study has stated that the company AEKI plc has successfully met all the challenges and targets as well as they also gained the market share. As cited by Lassala et al. (2017), the financial statements are more important for funding to the other firm for expansions. The company’s board of directors set up a meeting with a private equity firm Hedgehog Ltd and handed over the financial performance to the equity firm. Thus, their financial statement so that they can accept the offer to help the fund expansion further. The equity firm accepted the offer as they have seen their overall performance was stable and they can fulfil their requirement for fund expansions.
Part 3
1. Question 1
The product mix is a procedure of assorting the products to form a complete set of products that are the main requirement of some particular firm. According to Mohsin, AL-Bayati, and Oleiwi (2021), manufacturing techniques have made an approach of product mix in decision making.
As per the view of Product, the mix is done accordingly analysing the customer’s needs and thus different products that are similar to each other are combined together for product mix. The products are mixed accordingly by observing the needs of the customers and as per that the similar products are allocated. There are several dimensions of product mix are implemented for managing the problem of product scarcity.
There are different product lines of the companies according to which the numbers of the products of the companies are offered in a line. According to the product scarcity the companies use different strategies by implementing product mix in their companies.
There are many strategies such as expansion in the product mix to increase the product line of the company. However, contraction of product mix is also done and for managing the scarcity of the resources several changes are made in the visiting products, and new products are developed gradually. The producers are not able to fulfil the demand of the customers and cannot meet the requirements accordingly because of the lack of resources and labour hours available.
2. Question 2
(a) Labour is limited
| Sales Mix | L | M | N | O |
| Contribution per unit (C) | 11 | 18 | 40 | 37 |
| Labour hours (L) | 3 | 2 | 7 | 5 |
| Contribution per labour hour (C/L) | 3.7 | 9.0 | 5.7 | 7.4 |
| Rankings | 4th | 1st | 3rd | 2nd |
| Production Units | 0 | 6000 | 2571 | 6000 |
| Consumption of labour resources | 0 | 12000 | 18000 | 30000 |
| Total Consumption of Resources | 60000 | |||
| Details/Product | L | M | N | O |
| £ | £ | £ | £ | |
| Selling price per unit | 0 | 600000 | 295715 | 660000 |
| Variable costs: | ||||
| Labour (at £5 per hour) | 0 | 60000 | 90000.3 | 150000 |
| Material (at £4 per kg) | 0 | 108000 | 25714.4 | 72000 |
| Total Variable Cost | 0 | 168000 | 115715 | 222000 |
| Contribution | 0 | 432000 | 180001 | 438000 |
| Total Contribution | 1,050,000.60 | |||
Table 6: Profitable production mix when labour is limited
(Source: Created by the learner)
As per the conditions provided it is stated that the labour is limited for the particular work and the provided labour hour is 60,000. As stated, there are four products namely, L, M, N, and O, and the contribution of the products per unit is 11 for L, 18 for M, 40 for N, and 37 for O. However, the labour hours required by the products per unit are 3 for L, 2 for M, 7 for N and 5 for O. Accordingly, the required contribution per labour hour of the contribution unit per labour hour is 3.7 for L, 9.0 for M, 5.7 for N and 7.4 for O (case study).
As per the evaluation the rankings of the products were found that at first position M product after that at second position O product and then at third position N and lastly L product is at the fourth position. Hence, according to that, the consumption of the labour resources was done, and it was estimated that for the first product, M 12000 labour hours are allocated. Then for the second product, O 30000 labour hours are allocated. Then for the third product, N 18000 labour hours are allocated and thus last for the fourth product the labours are not available. Therefore, by allocating the labour hours according to this it is found that there can be a total profit amount of 10,50,000.60 possible (case study).
(b) Material is limited
| Sales Mix | L | M | N | O |
| Contribution per unit (C) | 11 | 18 | 40 | 37 |
| Material kilograms (M) | 6 | 18 | 10 | 12 |
| Contribution per Material kilograms (C/M) | 1.8 | 1.0 | 4.0 | 3.1 |
| Rankings | 3rd | 4th | 1st | 2nd |
| Production Units | 6000 | 1778 | 6000 | 6000 |
| Consumption of material resources | 36000 | 32000 | 60000 | 72000 |
| Total Consumption of Resources | 200000 | |||
| Details/Product | L | M | N | O |
| £ | £ | £ | £ | |
| Selling price per unit | 300000 | 177779 | 690000 | 660000 |
| Variable costs: | ||||
| Labour (at £5 per hour) | 90000 | 17777.9 | 210000 | 150000 |
| Material (at £4 per kg) | 36000 | 32000.2 | 60000 | 72000 |
| Total Variable Cost | 126000 | 49778 | 270000 | 222000 |
| Contribution | 174000 | 128001 | 420000 | 438000 |
| Total Contribution | 1,160,000.67 | |||
Table 7: Profitable production mix when the material is limited
(Source: Created by the learner)
As per the requirement, it was stated that the materials provided are limited and there are 200,000 kilograms of materials that are being allocated for the work. Therefore, the further process the number of materials that are required for contribution per unit is 11 for L and 18 for M and 40 for N and lastly 37 for O.
The material resources that are consumed by the products as per the rankings that is for the first product that is product N the consumed resource is 60000. After then for the second product that is product O the consumption of resources is 72000.
After that, for the third product that is product L, the consumption of resources is 36000, and then lastly for the fourth product, the consumption of resources is 32000. However, by dividing the material resource according to this way the possibility is to make the most amount of profit. Through the allocation of the material resources through this division the maximum amount of profit that can be estimated is 11, 60,000.67 (case study).
3. Question 3
As per the provided situation, the estimation was done and according to that, the company was not able to complete the requirement of the fourth product. The company needs to pay 2, 10,000 to allocate the labour hours to the fourth product to complete the requirement of production of the fourth product. Therefore, the company has to make a deal with the subcontractor and the company has to pay 2, 10,000 more to the subcontractor for completing the overall requirement of all the products and their productivity accordingly (case study).
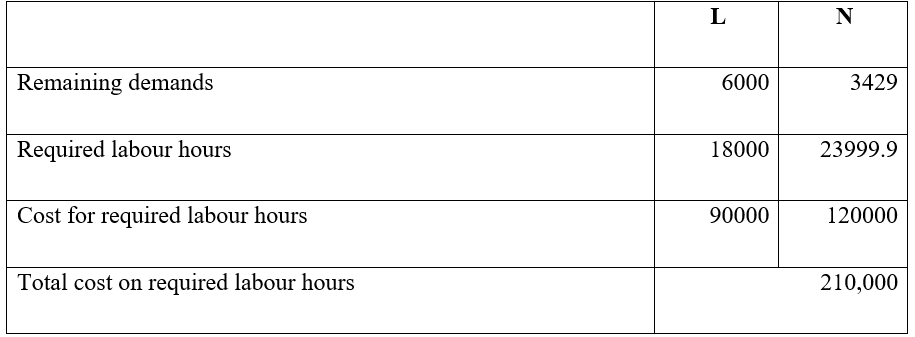
Table 8: Total cost on required labour hour’s breakdown
(Source: Created by the learner)
References
Elamer, A.A. and Benyazid, I., 2018. The impact of risk committee on financial performance of UK financial institutions. International Journal of Accounting and Finance, 8(2), pp.161-180. Available at: https://bradscholars.brad.ac.uk/bitstream/handle/10454/16621/9243857110610001000.pdf?sequence=1&isAllowed=y
Fathony, M., Khaq, A. and Endri, E., 2020. The effect of corporate social responsibility and financial performance on stock returns. International Journal of Innovation, Creativity and Change, 13(1), pp.240-252. https://www.ijicc.net/images/vol_13/13120_Fathony_2020_E_R.pdf
Hussain, J., Salia, S. and Karim, A., 2018. Is knowledge that powerful? Financial literacy and access to finance: An analysis of enterprises in the UK. Journal of Small Business and Enterprise Development. Available at: https://wlv.openrepository.com/bitstream/handle/2436/621662/Is%20Knowledge%20that%20Powerful%20(1).pdf?sequence=1
Hussain, N., Rigoni, U. and Cavezzali, E., 2018. Does it pay to be sustainable? Looking inside the black box of the relationship between sustainability performance and financial performance. Corporate Social Responsibility and Environmental Management, 25(6), pp.1198-1211. https://onlinelibrary.wiley.com/doi/pdfdirect/10.1002/csr.1631
Kartadjumena, E. and Rodgers, W., 2019. Executive compensation, sustainability, climate, environmental concerns, and company financial performance: Evidence from Indonesian commercial banks. Sustainability, 11(6), p.1673. https://www.mdpi.com/2071-1050/11/6/1673/pdf
Lassala, C., Apetrei, A. and Sapena, J., 2017. Sustainability matter and financial performance of companies. Sustainability, 9(9), p.1498. available at: https://www.mdpi.com/2071-1050/9/9/1498/pdf
Maassen, P. and Stensaker, B., 2019. From organised anarchy to de‐coupled bureaucracy: The transformation of university organisation. Higher Education Quarterly, 73(4), pp.456-468. Available at: https://onlinelibrary.wiley.com/doi/pdf/10.1111/hequ.12229
Mayakonda, A., Lin, D.C., Assenov, Y., Plass, C. and Koeffler, H.P., 2018. Maftools: efficient and comprehensive analysis of somatic variants in cancer. Genome research, 28(11), pp.1747-1756. Available at: https://genome.cshlp.org/content/28/11/1747.full.pdf
Melamed, J.R., 2018. Targeting hedgehog signaling with polycation-spherical nucleic acid nanoparticles for glioblastoma therapy (Doctoral dissertation, University of Delaware). Available at: https://udspace.udel.edu/bitstream/handle/19716/24121/Melamed_udel_0060D_13538.pdf?sequence=1
MOHSIN, N.M.R., AL-BAYATI, H.A.M. and OLEIWI, Z.H., 2021. Product-Mix Decision Using Lean Production and Activity-Based Costing: An Integrated Model. The Journal of Asian Finance, Economics and Business, 8(4), pp.517-527. Available at: https://www.koreascience.or.kr/article/JAKO202109554061430.pdf
Pattiasina, V., Sejati, F.R., Seralurin, Y.C., Batilmurik, R.W. and Al Aziz, M.A., 2018. The impact of financial ratios towards profit changes. International Research Journal of Management, IT and Social Sciences, 5(5), pp.1-16. https://core.ac.uk/download/pdf/230598419.pdf
Sameni, A.A. and Fakour, R., 2019. The Effect Of Working Capital Management On Financial Performance And Operational Cash Flows Of Companies Accepted In Tehran Securities Exchange. Humanities & Social Sciences Reviews, 7(6), pp.625-632. https://core.ac.uk/download/pdf/268005825.pdf
Know more about UniqueSubmission’s other writing services:
