
Principals of Financial Markets
Executive Summary
The main objective of this paper is to develop a fundamental analysis with concerning the aspect of the top-down analysis and bottom up analysis in the respect of Jacka Resource Limited and Jupiter Energy Limited. These both companies are involving in the oil and gas exploration industry. The findings top-down analysis show that there is mixed business opportunity for both companies in Australia. It because GDP and GDP growth are is declining continuously and interest rate, exchange rate and inflation rate are flowing in favour of business expansion. At the same time, by the bottom up analysis, it is found that both companies as Jacka Resource Limited and Jupiter Energy Limited are not performing well since 2014.

The current business environment is very dynamic due to this, it is essential for the companies to evaluate all the significant factors that can affect their financial performance. The main aim of this report is to conduct the top down and bottom up analysis for two companies from same industry. It allows the analyst or companies to identify the different factors that have impact of the financial performance of the company. For this, two companies are selected from oil and gas exploration industry and these companies are Jacka Resource Limited and Jupiter Energy Limited:
Jupiter Energy Limited
Jupiter Energy Limited deals in the oil and gas sector in Australia. The company is listed in Australia Stock Exchange (ASX) with the name of JPR. The company has 100 percent own production permit. The most of the employees of the company are based from Aktau office, the Company’s Operational Centre because the main production plan of the company is in Aktau. The company is also listed in the Kazakh Stock Exchange (KASE). The block 31 is main business operation plan of the company that has 13 year permit.
Jacka Resource Limited
Jacka Resource Limited also do the business activity in the oil and gas exploration industry. The company is successfully listed in the Australian Stock Exchange. The business operation of Jacka is speared in Australia, Tanzania and Somaliland. Jacka Resources Limited provide subsidiary opportunity to MX Oil Plc in August 2016 which information company disclosed in its financial report 2016.
In the economic performance of a country, there is a significant role of country’s economic policies and procedures. In order to measure the economic performance of a country, there are different parameters that can be used. In the reference of the Australia, the analyst can consider the various parameters to evaluate the economic performance. It is because these factors have a significant impact on the oil and gas exploration industry in Australia. In the economic performance of a country, interest rate, inflation rate, GDP and exchange rate are evaluated. In the same concern of Jacka Resource Limited and Jupiter Energy Limited, these factors may also be influenced (Besanko and Braeutigam, 2010). In the study of Australian economic, it is found that the business expansion in Australia is easy because there has not much business restrictions. The policies of the current government are also supported for the both companies to run the business activities smoothly. In this, some policies are such EXIM, fiscal and monetary policies help to oil and gas exploration industry in the context of the taxation, capital budgeting and investment decisions.
Along with this, economic condition of a country also defines the ability of the customer to buy the expensive product in the market. It has a great impact on a particular industry of a country. In the oil and gas exploration industry of Australia, there is a lots number of companies that drive the economic condition of the country. At the same time, it can also be seen that recession at the global level also affect the oil and gas exploration industry of Australia. It is identified that after the influence of the economic meltdown, Australian people concern on the price of product and now these have become more price sensitive (Boyes and Melvin, 2013). These also have desire to achieve the more effective product in the competitive price. In the last some years, the changes in economic condition of Australia have been evaluated that are determined below:
The following graph depicts the changes in Australian GDP growth rate in the last ten years:
Figure 1: Australia GDP Growth Rate

(Source: Trading Economics, 2017)
In the context of Australian DGP growth rate, it is found that in the last ten years, the growth rate has been remained fluctuated. In the above graph, it can be seen that in the last ten years, the GDP growth rate has been remained below 1% that indicates that Australian economic is facing issues. In the financial year 2007, Australian GDP growth was identified at 1.5% and after this, it is continuously recorded below 1%. Even though, in the mid of this, in 2011, Australian GDP growth rate was increased by 1.3 but after this it declined by 0.6% in the year 2017. It shows that Australian GDP growth rate is declining continuously. At the same time, there has also prediction that GDP growth rate will continue decline in future. Hence, it can be said that DGP growth that has negative impact on the oil and gas exploration industry in Australia (Atkinson and Stiglitz, 2015).
The below graph shows Australian GDP in the recent years:
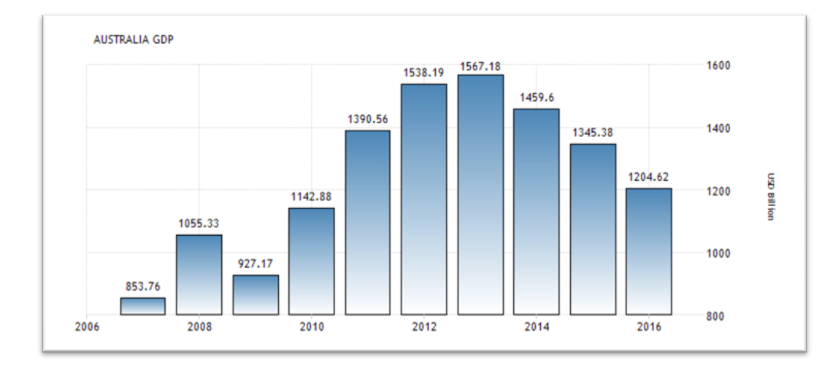
(Source: Trading Economics, 2017)
The above graph shows that the current GDP of Australia is $1204.62 billion that is also declining from 2013. In 2007, it was found by $853.76 billion that was reached $1142.88 billion in 2010. After this, in 2013, it was increased $1567.18 billon. But after this, it is declining continuously. It is not good indicator for the Australian economic and also affects the oil and gas exploration industry negatively. The cause of decline in the Australia GDP may be decrease investment in the oil and gas exploration industry. At the same time, the decline in GDP can also affect the sales and financial performance of Jacka Resource Limited and Jupiter Energy Limited (Bowen and Finegan, 2015).
The below graph shows the Australia GDP per capita:
Figure 3: Australia GDP Per Capita
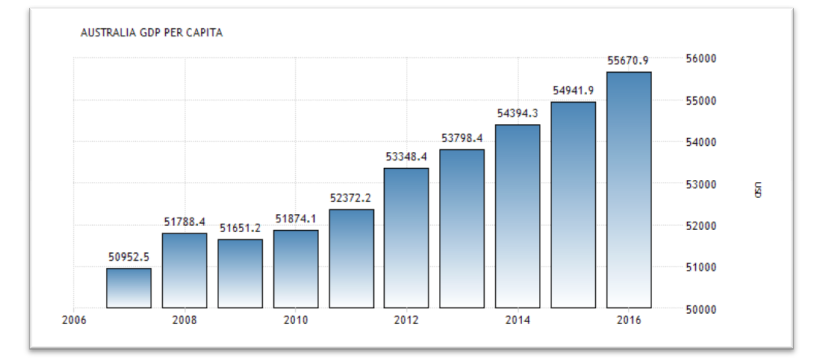
(Source: Trading Economics, 2017)
On the basis of above graph, it can be determined that there is a significant growth in the context of Australia GDP per capita. The current GDP per capita is $55670.9 that has increased $50952.5 from the year 2007. However, in 2009, it was declined some but it came back on the track. The increasing GDP per capita indicates that strong willingness of the customer in Australia. It is good indicator for both companies such as Jacka Resource Limited and Jupiter Energy Limited because it can take the advantage from this as increasing sales and revenue (Clawson and Knetsch, 2013).
Inflation rate also determine the economic performance of a country. The below graph shows Australia inflation rate:
Figure 4: Australia Inflation Rate
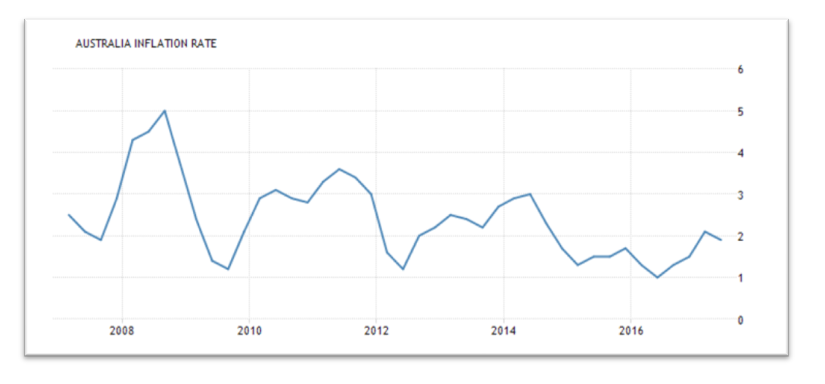
(Source: Trading Economics, 2017)
On the basis of the above graph, it can be determined that the current inflation rate in Australia is near 2. In the last ten years, it is found that it has been remained fluctuated. The principle of the inflation rate depicts that an increase in the inflation leads to increase in the price of product and services in the country. On the other hand, a decrease in the inflation rate leads to decline in the price of the product and services. Inflation rate of Australia is going to increase since 2015. The increasing the inflation rate also negatively affects the purchasing power of the customer and it can affect the sales of Jacka Resource Limited and Jupiter Energy Limited in Australia. Hence, the decline in the sales of Jacka Resource Limited and Jupiter Energy Limited will affect their financial performance (Fujita and Thisse, 2013).
In order to measure the economic performance of a country, analysts also measure the FDI. In the context of Australia, GDI figure is below:
The above figure shows that FDI is increasing in Australia and it is recorded by AUD64825 million in the year 2016. Along with this, there is also expectation that it will increase in future. An increase in the FDI in country indicates that business performance of the companies will improve. It is also good indicator for the economic performance of the overall country. An increase in the FDI also ensures the availability of the financial resource for business expansion. At the same time, it also provides power to government expenditure and provides employment in the country. From this, it can be said there is significant business opportunity for Jacka Resource Limited and Jupiter Energy Limited. Beside of this, these companies can also face completion in the industry due to increase foreign competitors (Nagurney, 2013).
Interest rate in a country has also impact of the financial position of the companies. It a decrease or increase in the interest rate affect the investment and financial decision of a company. The below graphs shows the interest rate trend in Australia:
As concerning the above graph, it can be interpreted that the current interest rate in Australia is near 1.5%. It is continuously decreasing in the country. At the same time, future predication is that it will remain constant in the future. In the last ten year interest rate has declined from 8% to 1.5%. It shows that in Australia, there are good opportunities for companies to raise fund at the minimum cost. Hence, both companies such as Jacka Resource Limited and Jupiter Energy Limited are facelifting by the low interest rate. It is helpful for the companies to decline the cost of the investment and finance. Therefore, these companies have to pay less interest on the financial that will raise the profitability the company. In the same concern of this, a decrease in the interest rate will also encourage the Australia public to purchase more vehicles that will increase the demand of oil and gas in the country (Pearce, et. al. 2013). It will increase the purchasing power of the Australian people that can increase the sale of the both companies in future.
Exchange rate is also a significant factor in measuring the financial performance of a county. It depicts the value of the country’s currency against another currency. The following graph demonstrates the exchange rate of AUD with respect to USD
In the current time, the value of the Australian dollar is increasing continuously. The current exchange rate of Australian dollar is 0.81 US dollar. In the last decades, it has been observed that is high fluctuation in Australian exchange rate. Due to this, there is risk of affective the business activity of the oil and gas exploratory industry. However, in current time rate of Australian dollar is increasing that means, it will increase the revenue and profitability of the company (Rios, et. al. 2013).
Bottom-up analysis of Jacka Resource Limited and Jupiter Energy Limited is presented in the following table:
| Performance measures | 2016 | 2015 | 2014 | |||
| JACKA RESOURCE LIMITED
|
JUPITER ENERGY LIMITED
|
JACKA RESOURCE LIMITED
|
JUPITER ENERGY LIMITED
|
JACKA RESOURCE LIMITED
|
JUPITER ENERGY LIMITED
|
|
| Earnings per share | -0.9c | -7c | -11c | -7.2c | 3.1c | -1.7c |
| Dividends per share | 0c | 0c | 0c | 0c | 0c | 0c |
| Net Gearing (%) | -126 | 1139 | -23.4 | 76.2 | -19.1 | 39.3 |
| Net Profit Margin (%) | — | — | — | -281.9 | — | -33.6 |
| Return on Equity (%) | -529.4 | -289.9 | -536.6 | -26.4 | 20.9 | -26.4 |
(Source: InvestSmart, 2017) -6.4
Earnings per share (EPS)
EPS is the indicator which presets the particular part of the profit that is available for the outstanding shareholders. The stock values and dividends are based on EPS as the shareholders expect from it to be higher. It indicates the reliability for investments in future and strong financial health of the firm (Tracy, 2011). The EPS for both firms is presented in the above table that shows loss of money by both firms. It means the earnings are negative as both firms are losing money per share of outstanding stock. In 2016, JRL has lost less money per share in comparison of JEL. At the same time, JRL continues to narrow its losses and move towards a positive EPS. It may be beneficial for the JRL to attract the shareholders and investors (Wang, 2010).
Dividends per share (DPS):
Dividend per share is the part of the net profit that is distributed to the outstanding shareholders. It is also expected to be high by the shareholders because it shows the ability of the firm to maximize the shareholders’ wealth in the specific period (Samonas, 2015). After identifying the dividends for both firms, it can be stated that no firm has distributed dividend to their shareholders. It is because both firms are not able to generate sufficient profits for the investors as they are not capable to distribute the dividends to their shareholders. This strategy can be destructive for the firms because it will not be advantageous to attract more investors.
Net Gearing:
Net gearing ratio shows the capital structure of the firm in terms of total debt and total shareholders’ equity. It is effective for the firm to reduce the cost of capital and maximize the shareholders’ wealth. It also indicates how much efficient is the firm to pay its outstanding debts by using equity (Porter, & Norton, 2010). Based on the above table, it can be interpreted that JRL is facing negative gearing during this period with rising trend. It means the firm is facing troubles in raising money to cover historical net losses. It also shows that the firm is facing higher interest on debt than the investment returns (Mayo, 2015). On the other hand, JEL is facing positive gearing ratio during this period with rising trend means it is able to pay its debts through equity effectively. However, this ratio for JEL is very high that may be risky for the firm and its stocks.
Net Profit Margin:
Net profit margin is the percentage of revenue that is left after deduction of all expenses. It is expected that net profit margin should be high showing sufficient returns to the investors. It is required for successfully operating the firm. It can be stated from the table that both firms did not get profits as they are facing losses continuously during this period (Marsh, 2012). No firm can be said in profitable situation as the firms are not able to control their costs of operations and generate sufficient revenues to earn profits. It may be disadvantageous for the firms to attract the investors for the investment.
Return on Equity (%):
This ratio shows the ability of the firm to provide returns on the invested capital by the shareholders. It is also expected to be high because it is required for the investors to get higher returns on their investment. It is effective indicator to attract the shareholders for the investment (Aplia, 2011). This ratio is declining for both firms but JEL is in better position than JRL because is less negative during this period.
Conclusion and Recommendations
On the basis of the above discussion, it can be summarized that both firms including JACKA RESOURCE LIMITED and JUPITER ENERGY LIMITED are not performing well during 2014 to 2016. Based on the top-down analysis, it can be stated that declining GDP and increasing inflation may have adverse impact on the energy sector. But at the same time, decreasing trend in interest rate and increasing trend in exchange rate may cause better opportunities for the energy sector business. The economic conditions of Australia may have a considerable impact on the business of energy sector. In order to solve these issues, it may be effective for the firms to focus on cost reduction and price control of their products and services. It would be effective for the organizations to maintain market share and handle the adverse economic aspects of Australia. In addition, it can also be concluded from top-down analysis that both firms are not performing well financially as their EPS, DPS and return on equity are not showing better results during 2014 to 2016. However, JRL is showing the movement towards positive EPS that can be beneficial for the firm to attract more investors. Apart from this, gearing ratio is also high for JEL but it is negative for JRL indicating better position of JEL in paying its debts through equity. In addition, net profit margin for both firms is also negative showing loss situation for both firms in their industry.
On the basis of this analysis, it can be recommended to both firms that here is need for the management to focus on its sales and marketing strategies to increase revenues and profits. Firms can adopt effective marketing tactics and sales strategies to increase revenues and increase their net profits. Apart from this, it may also be beneficial for JRL to make a proper balance in capital structure to make it positive. By increasing sales and decreasing the cost of operations, the firms can increase their profits and enhance the returns on equity. It will be beneficial for the firms to distribute dividends to their shareholders by increasing profits and revenues. Through dividend policy, the firm will enable to attract more investors and increase its market share. Along with this, it can be effective to focus on price control to attract the customers and increase their sales to overcome the economic issues. In addition, there is need for the firms to manage cash by effective inventory management and accounts receivable policy. It will be beneficial for the organizations to maintain the cash and handle the business operations smoothly.
Aplia, T. (2011) Corporate Financial Accounting. Canada: Cengage Learning.
Atkinson, A.B. and Stiglitz, J.E. (2015) Lectures on public economics. USA: Princeton University Press.
Besanko, D. and Braeutigam, R. (2010) Microeconomics. 4th (edn.) United States Of America: John Wiley And Sons.
Bowen, W.G. and Finegan, T.A. (2015) The economics of labor force participation. USA: Princeton University Press.
Boyes, W. and Melvin, M. (2013) Microeconomics. 9th (edn.) United States Of America: South Western Cengage Learning.
Clawson, M. and Knetsch, J.L. (2013) Economics of outdoor recreation. UK: Routledge.
Fujita, M. and Thisse, J.F. (2013) Economics of agglomeration: cities, industrial location, and globalization. UK: Cambridge university press.
InvestSmart, (2017) JACKA RESOURCE LIMITED. [Online] Available at: https://www.investsmart.com.au/shares/asx-jka/jacka-resources-limited (Accessed: 20 September 2017)
InvestSmart, (2017) JUPITER ENERGY LIMITED. [Online] Available at: https://www.investsmart.com.au/shares/asx-jpr/jupiter-energy-limited (Accessed: 20 September 2017)
Marsh, C. (2012) Financial Management for Non-Financial Managers Strategic Success. UK: Kogan Page Publishers.
Mayo, H. (2015) Basic Finance: An Introduction to Financial Institutions, Investments, and Management. USA: Cengage Learning.
Nagurney, A. (2013) Network economics: A variational inequality approach. Germany Springer Science & Business Media.
Pearce, D., Barbier, E. and Markandya, A. (2013) Sustainable development: economics and environment in the Third World. UK: Routledge.
Porter, G.A. & Norton, C.L. (2010) Financial Accounting: The Impact on Decision Makers. USA: Cengage Learning.
Rios, M.C., McConnell, C.R. and Brue, S.L. (2013) Economics: Principles, problems, and policies. USA: McGraw-Hill.
Samonas, M. (2015) Financial Forecasting, Analysis and Modelling: A Framework for Long-Term Forecasting. UK: John Wiley & Sons.
Tracy, J.A. (2011) Accounting For Dummies. USA: John Wiley & Sons.
Trading Economics (2017) Australia. [Online] Available at https://tradingeconomics.com/australia/gdp-growth (Accessed: 20 September 2017)
Trading Economics (2017) Australia. [Online] Available at https://tradingeconomics.com/australia/inflation-cpi (Accessed: 20 September 2017)
Trading Economics (2017) Australia. [Online] Available at https://tradingeconomics.com/australia/interest-rate (Accessed: 20 September 2017)
Trading Economics (2017) Australia. [Online] Available at https://tradingeconomics.com/australia/gdp-per-capita (Accessed: 20 September 2017)
Trading Economics (2017) Australia. [Online] Available at https://tradingeconomics.com/australia/indicators (Accessed: 20 September 2017)
Wang, X. (2010) Financial Management in the Public Sector: Tools, Applications, and Cases. UK: M.E. Sharpe.
