
IMPLEMENTING SEVERAL TECHNIQUES FOR DATA ANALYTICS
Executive Summary
The report covers and highlights several “data analytic techniques.” The concepts of data warehouse and data mart have been highlighted in this report. The objectives of the report and the “data warehouse architecture” have been covered in this report. The system requirement and the source of data are mentioned and highlighted in this report.
The ETL implementation with codes, snippets is mentioned indicating the proper execution of the system. The dashboard is obtained from the tableau after the data is evaluated and analyzed in that software. The report concludes with a concluding segment which summarizes the key findings of the report.

Data warehouses combine information gathered from external sources and put them into a “comprehensive database.” “Data warehouse” collect data and other information’s from the domains. In the business field or activity, the data warehouse helps in incorporating the customer information that is controlled by the “company’s sales system.” The system implementation of the data warehouse has been carried out and analyzed in the following report.
The purpose of this assessment or task is to execute and perform ‘Business Intelligence” for “data analytics.” It involves various methods and technologies learned throughout the module.
Data warehousing assist and support numerous technologies that utilize the information and the data which are present in the “system database.” The data or the information which were collected can be gathered within a warehouse from the domains. The domains were indicated and mentioned in the following section.
- “Tuning production strategies”: These strategies are finely tuned. They are tuned while “repositioning the products” and also helps in the management of the product portfolios.
- Analysis of the customers is carried out by evaluating the buying preference of the customers and clients. Their budget and the buying times are also highlighted or mentioned.
- The “operation analysis” include “data warehousing” that highlights the “customer relationship management”. Business operations can be visually presented using these techniques or methodologies.
2.3 Data Warehouse Architecture
“Data Warehouse” is a “heterogeneous collection” for numerous data sources which are present in the schema model. Two approaches or activities can be used for the schema. The two approaches or architecture that forms an integral part of the “data warehouse architecture” include:
2.4 Requirement
Data warehousing is a critical concept that involves several aspects and factors. Five essential requirements for creating or implementing a “data warehouse” application are:
- Executive Sponsorship.
- Proper infrastructure
- Design of the data warehouse
- Analytical Technology with “business intelligence.”
- Properly defined business requirements. (com, 2019)
These are the resources or materials used for executing and implementing the proposed database system.
The data warehouse is created or implemented for the given task. The “nutrient analysis” of food and vegetables “are evaluated and assessed. The data source is kept inside a folder named “databse+ETL” which is held under the main folder named p2. The source is kept in .txt format which can be opened using the application Notepad ++. A snippet of the data source is provided.
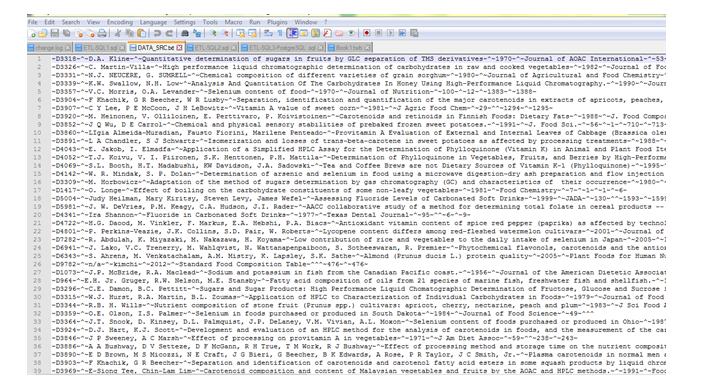
Figure 1: Data Source
(Source: Database)
It is considered as the basic or fundamental schema inside the “data mart schema”, and it is quite easy to use. The schema can be used for developing and implementing a data warehouse or data mart. The schema generally contains two or more tables and arranged in a star-shaped pattern. The schema for this work is created, and it contains two “table types.” These two tables include the dimension table and the fact table. “General queries” can be handled by the star schema.
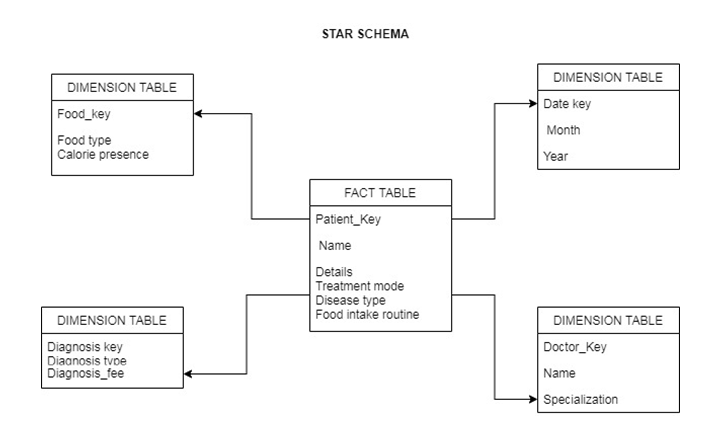
Figure 2: Star Schema
(Source: Database)
Star Schema Models
Two types of tables can be used in the star schema models. They are, in fact, table and dimension tables. The “fact table” contains the “quantitative data” for a business. The “descriptive statistics” constitute or contain in the fact table.
Advantages and Disadvantages
The advantages of the star schema are numerous. They help in simplifying the query in the database and execute it (Singh, 2019). The reporting business logic can also be simplified using the star schema. The “OLAP cubes” can be highlighted and designed with the help of “star schema.
“Star schema models” also possess some disadvantages. “data integrity” is not directly implemented or enforced. This model is not flexible. The “many to many” relationship is not included or highlighted while using this model or design.
ETL is a process or system in the “data warehousing” which stands for “extract, transform and load.” It extracts data from numerous sources and then changes it into the “staging area.” The staging area is followed by the loading phase where the data is loaded into the “data warehouse system” (Astriani and Trisminingsih, 2016). A basic overview of the ETL process is shown.
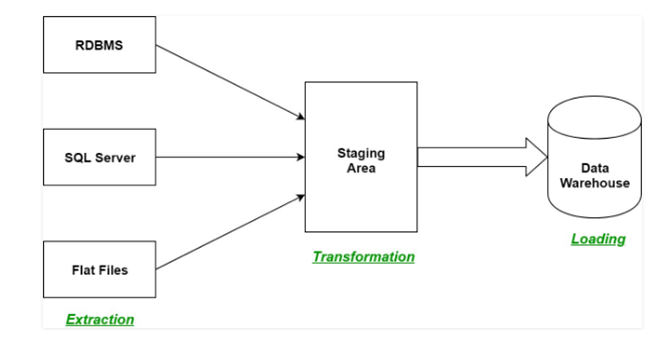
Figure 3: ETL layout or phases
(Source:https://www.geeksforgeeks.org/etl-process-in-data-warehouse/)
The code used or implemented for the ETL process for the system is given or provided.
ETL SQL 1
This is the first code that is implemented and utilized for teh ETL process in the given warehouse.
“MODULE_NAME
config
etls
queries
schemas
describes
postgres
**SCRIPT_NAME.sql** – Script for PostgreSQL.
mssql
**SCRIPT_NAME.sql** – Script for MS SQL Server.”
ETL SQL 2
This is the second ETL code that has been utilized while implementing the “data warehouse.”
CREATE SCHEMA target1;
GO
CREATE procedure [target1].[normalizePatientData] (@transformRunId integer)
as
begin
UPDATE Patients SET Gender=’Female’ WHERE (Gender=’f’ OR Gender=’F’);
UPDATE Patients SET Gender=’Male’ WHERE (Gender=’m’ OR Gender=’M’);
end
GO
CREATE TABLE target1.Patients
(
RowId INT IDENTITY(1,1) NOT NULL,
Container ENTITYID NOT NULL,
CreatedBy USERID NOT NULL,
Created DATETIME NOT NULL,
ModifiedBy USERID NOT NULL,
Modified DATETIME NOT NULL,
PatientId INT NOT NULL,
Date DATETIME NOT NULL,
LastName VARCHAR(30),
FirstName VARCHAR(30),
MiddleName VARCHAR(30),
DateVisit DATETIME,
Gender VARCHAR(30),
primary language VARCHAR(30),
Email VARCHAR(30),
Address VARCHAR(30),
City VARCHAR(30),
State VARCHAR(30),
ZIP VARCHAR(30),
Diagnosis VARCHAR(30),
CONSTRAINT PatientId PRIMARY KEY (RowId)
);
ETL SQL 3
This is the third SQL code provided for evaluating and assessing the given “data warehouse.” for the system.
—————
— schema1 —
—————
DROP SCHEMA schema1 CASCADE;
CREATE SCHEMA schema1;
CREATE TABLE schema1.patients
(
date timestamp without time zone,
startdate timestamp without time zone,
country character varying(4000),
language character varying(4000),
treatmentgroup character varying(4000),
status character varying(4000),
comments character varying(4000),
CONSTRAINT patients_pk PRIMARY KEY (patientid)
);
CREATE OR REPLACE FUNCTION changecase(searchtext varchar(100), replacetext varchar(100)) RETURNS integer AS $$
UPDATE schema1.patients
SET gender = replace text
WHERE gender = search text;
SELECT 1;
$$ LANGUAGE SQL;
Some screenshots of the ETL transformation for the system are represented or indicated in the following pictures.
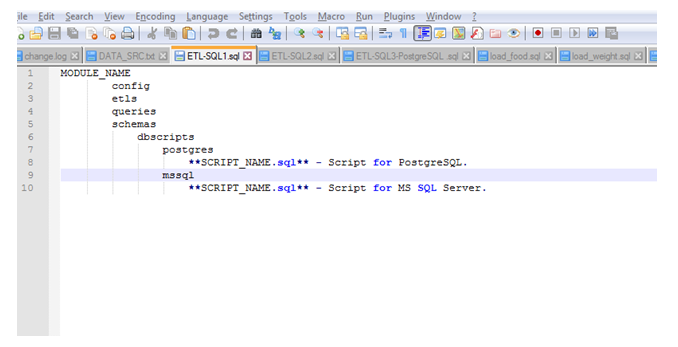
Figure 4: ETL code screenshots
(Source: SQL Database)
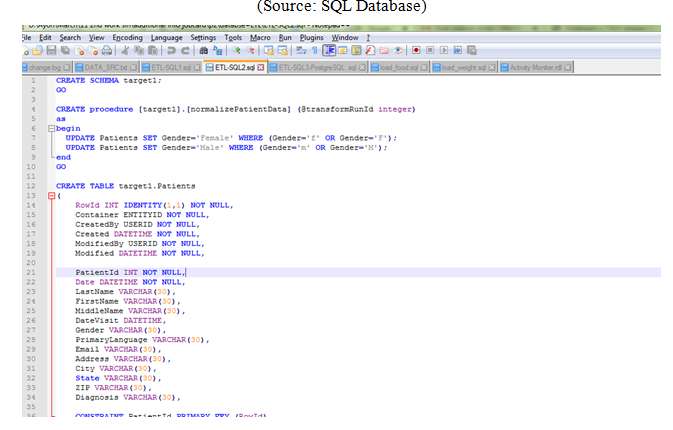
Figure 5: ETL Code screenshots
(Source: SQL Database)
Figure 6: ETL Code screenshots
(Source: SQL Database)
ETL process in the given data warehouse
The three steps that are involved while implementing and evaluating the codes have been discussed.
Extraction
This is the primary or the first phase for the ETL. The data from their source is extracted, which is stored in some formats in the “relational databases.” The data are selected from the source, and it is being stored in the “staging area” before proceeding with the next stages. Loading the data warehouse directly in the “data warehouse” may damage the system or the application.
Transformation
This is the second step which is carried out or implemented while creating or evaluating the proposed system. The functions and other rule sets are used and applied over the “extracted data.” This data is then converted in the “standard format.” Some processes or activities which are utilized and used in this transformation process for the given task include “filtering, cleaning, joining”, sorting, splitting and the joining.
Loading
This is the final phase or process that is utilized in the system development of the data warehouse (Khine and Wang 2018). The “transformed data” is loaded in the system “data warehouse.” The time and the period for the loading depend upon the necessity and requirement of the database model or design, and it varies with the systems. (geeksforgeeks.org, 2020)[Referred to Appendix 1]
The dataset or the data warehouse is created and implemented in the tableau. The screenshot for the dashboards is indicated and represented in the picture.
Figure 7: Dashboard visualization
(Source: Tableau software)
Analysis
The “enterprise datasets” are quite large in number. They are sometimes complicated and give detailed information. The reports which are created in various tools and applications helps in analyzing the data warehouse designed for this task or activity. Any “traditional business intelligence” or BI application offers dashboards, graphs and other test-related reports. The data which has been used here for the evaluation have been “sliced, diced and interrogated.” The visualizations which are implemented or derived from the data warehouse help the people or the users in understanding the related “enterprise data warehouse.” Some implications and applications of data visualization are given.
- It helps in the communication of information in a fast manner.
- It creates visualization which helps the programmers and the users in visualizing the data and solve complicated queries.
The software or the application used for creating the dashboards in tableau. This software helps businessman and other users in accessing, evaluating and sharing any “analytical framework” that were implemented for the data warehouse application.
Data warehousing is a critical technique that needs proper implementation and evaluation. The data warehouse technique or application for the system is implemented. The ETL codes are provided and mentioned for extracting, transforming and loading the data.” The dashboards are created in the tableau for analyzing and evaluating the data warehouse. An analysis is performed, which further strengthens the concepts and theory related to “data warehousing” and “data marting techniques.”
Journal
Astriani, W. and Trisminingsih, R., 2016. Extraction, Transformation, and Loading (ETL) module for hotspot spatial data warehouse using geokettle. Procedia Environmental Sciences, 33, pp.626-634.
Kohn, P.P. and Wang, Z.S., 2018. Data lake: a new ideology in big data era. In ITM Web of Conferences (Vol. 17, p. 03025). EDP Sciences.
Khine, P.P. and Wang, Z.S., 2018. Data lake: a new ideology in big data era. In ITM Web of Conferences (Vol. 17, p. 03025). EDP Sciences.
Singh, S., 2019. Survey paper on data warehouse architecture. International Journal for Emerging Research and Development, 2(1), pp.1-3.
Online Article
hrmars.com, 2019, Data Warehouse Design and Implementation. Available at http://hrmars.com/hrmars_papers/Data_Warehouse_Design_and_Implementation_Based_on_Star_Schema_vs__Snowflake_Schema.pdf [Accessed on 2.3.2020]
Website
geeksforgeeks.org, 2020, ETL process in Data Warehouse. Available at https://www.geeksforgeeks.org/etl-process-in-data-warehouse/ [Accessed on 2.3.2020]
Appendix 1: ETL Process flow
(Source: https://2.bp.blogspot.com/-dSnbfUATfoU/U7opdrbBKTI/AAAAAAAACkU/EAnBsiIyPaY/s1600/ETL-process-flow.jpeg)
