SP0745 INTERNATIONAL RESOURCE MANAGEMENT IN SPORT
Module Code And Title – SP0745 INTERNATIONAL RESOURCE MANAGEMENT IN SPORT
1. Introduction
The report is based on analysing the financial factor of Nike for the financial management of resources. In this study, the concept of financial performance and key financial development has been critically evaluated for a better understanding of the organisation. Recommendations based on management accounting have been critically provided in the study for the issues and risk factors.
Organisational background
Nike is an American based multinational corporation that is involved in manufacturing, designing and developing the worldwide sales and marketing of footwear, apparel, accessories and services (Nike.com, 2022). Nike is best known globally for its reputed brand image and is recognised as one of the most valuable sports brands in business among the others. The aim of the sports brand organisation is to bring innovation and inspiration to every athlete across the world. Nike is recognised as a unique brand as it has high-quality manufacturing products and good looking shoes that are designed for professional and fashion apparel. As opined by Summerley (2020), this organisation sponsors multiple sports teams and creates tons of money. The mission of the largest sports shoe brand is to do almost everything possible to extend human capital.
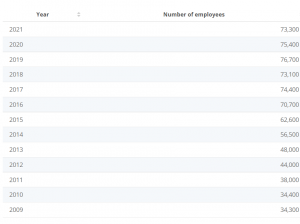 Figure 1: Employees estimation of NIKE (Source: Statista.com, 2022)

The corporate vision of Nike is to be the most distinctive, connected and authentic sports brand which continues to apply this vision statement for the development of its brand reputation. Nike is a highly successful brand because it has celebrity endorsements and iconic catchphrases. Nike employed around 73,300 employees across the world as of 2021 which demonstrate the Size of the organisation (Nike.com, 2022). This organisation is the Equipment supplier and sportswear brand based in the US.
Key financial development
Nike claimed that the net income in 2022 has increased to 1.34 billion dollars or 83 cents a share from 1 billion dollars as per 2021 (Cnbc.com, 2022). The revenue of the company has risen 1 % to 11.3 6 billion dollars from 11.2 4 billion dollars which are outpacing the calculation of 11.25 billion dollars. The COVID-19 and its pandemic situation have led to the closure of the factory overseas this load shipment of inventory which is reflected in the report. Moreover, the financial officer of the company claimed that the production process in the country has been increased by 80 per cent of the levels of pre-closure. Financial officers of this large sport and Organisation claim that the revenue in the region of the Middle East, Africa and Europe has grown by 6 per cent whereas in Greater China has fallen by 20 per cent (Cnbc.com, 2022).
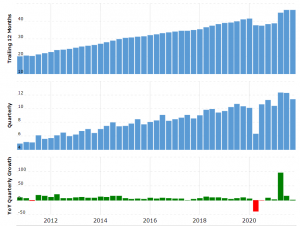 Figure 2: Nike’s revenue (Source: Macrotrends.net, 2022)
Financial development of the economy requires the sector of finance which happens in the process of development and founding of institutions. The gross profit margin of the fourth quarter of the organisation has maximised basis points of 850 to 45.8 per cent (Nike.com, 2022). Nike reported that the overall revenue of the organisation has increased by 19 per cent to 44.5 billion dollars (Nike.com, 2022). In Nike, financial development helps the organisation in minimising the cost of acquiring Information, making contracts and enforcing the transactions that are consequences of the emergence of intermediaries and the financial market.
2. Critical discussion and definition
Concept of performance
The organisational performance of Nike includes evaluating the performance of the organisation against goals and objectives. The organisational performance consists of the original output or outcome of the company as calculated against its intended output (Kemp et al. 2021). Organisational performance refers to market performance, financial performance and stakeholder value. Market performance estimates how well the product or the organisation formed in the potential market. Market performance increases if the up-gradation of product assists in boosting sales.
Market performance of Nike
The largest athletic shoe production across the world has an estimated market share of approximately 50% and sells a broad range of apparel under its own brand and some of the affiliated brands such as Hurley and Converse (Statista.com, 2022). Nike has the largest number of factory stores in the US which is estimated at 204 as the total number of retailing stores Nike across the world is 1048 (Statista.com, 2022). The strategy of corporate social responsibility of Nike is to prioritise the customer as a group of stakeholders. In this organisation, the interests of stakeholders include reasonable prices and high-quality products which the largest sports brand organisation have obtained from the investment of R&D (Escamilla-Fajardo et al. 2021). For instance, Nike consistently gives products with advanced technology and high quality. Considering the developed sales revenue and high profitability of Nike, it satisfies the customer as the top priority stakeholder group. Nike identifies the employees’ significance as the stakeholder groups that impact the effectiveness of the organisation (Quinn et al. 2018). The performance of applied directly translates to the business and market performance which includes career development opportunities, fair compensation and a sense of purpose. Addressing these two major stakeholders of the organisation helps Nike to establish its potential image in the potential market.
Concept of financial performance
Financial performance is referred to as the subjective calculation of how well an organisation can utilise the assets from a basic model of business and generate revenue (da Silva and Las Casas, 2020). The financial performance of Nike is estimated by certain factors which include ownership, age, liquidity and size. Nike is the owner of a wide number of brands which includes Jordan, Converse and Nike and the size of the organisation and earning revenue demonstrated the financial performance of the organisation.
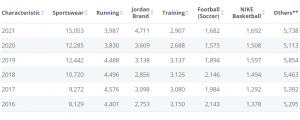 Figure 3: Worldwide revenue of Nike from 2016 to 2021 by category (Source: Statista.com, 2022)
The “direct-to-consumer revenue of Nike is estimated as 16.37 billion USD and the estimated E-commerce sales of Nike are 6.8 billion dollars (Statista.com, 2022). The organisation has earned revenue from sports footwear sales of approximately 23.31 billion USD (Statista.com, 2022). Nike has huge competitors in the sector of shoe and apparel clothing which includes Adidas, Puma, and Under Armour.
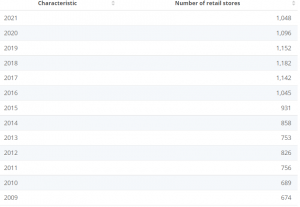 Figure 4: Number of retail stores of Nike (Source: Statista.com, 2022)
Nike has increased the brand revenue by 12% on a currency-neutral basis that is behind the direct double-digit growth of Nike in North America, EMEA and APLA (Statista.com, 2022). Nike finances its debt which is generally senior to equity finance in the liquidation event and its debt is rated A1 by Moody’s and AAQ-by standard & Poors. The globalisation of Nike is impacted by the local economy where its stores are situated and improved resources from the area. As opined by Dar and Mishra (2020), the largest sportswear brand contributes high to the economy with its taxes and fees eradicating poverty. Nike is financially stable with a bottom line that is based on growth in earnings per share and steady stock performance.
3. Use of financial analysis tools
Financial analysis tools are significantly helpful in the measurement of the financial position and financial health of Nike Inc of two different years. The financial analysis tools involve the calculation and illustration of accounting ratios, which shows the different performance attained by the firm (Anis, 2020). The accounting ratios include the calculation of liquidity, profitability, shareholders, and efficiency ratios, which depicts the overall performance attained by the firm in 2019 and 2020. Therefore, with the help of the ratio analysis, the management of Nike Inc can understand the shortcomings faced by the company during 2019 and 2020. Hence, by applying accounting techniques the company would eliminate all the shortcomings of their business (Fusco and Migliaccio, 2018). As for this, all the financial ratios are calculated and explained below which will show the financial performance attained by Nike Inc.
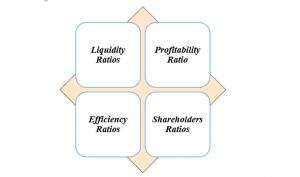 Figure 5: Accounting ratios (Source: Created by the researcher)
Liquidity Ratios
| Calculation of Current Ratio | ||||
| 2020 | 2019 | |||
| Current ratio | 2.48 | 2.10 | ||
| Current assets | $ 20,556.00 | $ 16,525.00 | ||
| Current liabilities | $ 8,284.00 | $ 7,866.00 | ||
Table 1: Current ratio (Source: S1.q4cdn.com, 2020)
| Calculation of Cash Ratio | ||||
| 2020 | 2019 | |||
| Cash Ratio | 1.01 | 0.57 | ||
| Cash and cash equivalent | $ 8,348.00 | $ 4,466.00 | ||
| Current liabilities | $ 8,284.00 | $ 7,866.00 | ||
Table 2: Cash ratio (Source: S1.q4cdn.com, 2020)
Illustration
Liquidity ratios are computed in the above table which shows the liquidity position of Nike Inc in 2019 and 2020. The liquidity ratios are also important for measuring the capability of the company in payment of their business obligations with the help of current assets (Gong, 2020). Therefore, the cash ratio was 0.57 in 2019 and 1.01 in 2020 that of the current ratio was 2.10 in 2019 and 2.48 in 2020. Both the ratios show an enhancement in the current assets and cash position in 2020 in comparison to 2019 as a result the liquidity ratios have enhanced in the current year. This is a positive indication for the company since they have a strong ability to pay off their obligations by their current assets of the business (Krylov, 2018). Hence, it would also be helpful for the company in maintaining the business operations with the help of their financial and business resources.
Profitability Ratio
| Calculation of Gross Profit Ratio | ||||
| 2020 | 2019 | |||
| Gross profit ratio | 43.42 | 44.67 | ||
| Gross Profit | $ 16,241.00 | $ 17,474.00 | ||
| Revenue | $ 37,403.00 | $ 39,117.00 | ||
Table 3: GP ratio (Source: S1.q4cdn.com, 2020)
| Calculation of ROCE | ||||
| 2020 | 2019 | |||
| Return on capital employed | 13.51 | 30.11 | ||
| EBIT | $ 3,115.00 | $ 4,772.00 | ||
| Capital Employed | $ 23,058.00 | $ 15,851.00 | ||
| Total assets | $ 31,342.00 | $ 23,717.00 | ||
| Current liabilities | $ 8,284.00 | $ 7,866.00 | ||
Table 4: ROCE ratio (Source: S1.q4cdn.com, 2020)
Illustration
Two different profitability ratios are calculated in the above table that is GP ratio and ROCE ratio. Both the ratios are one of the strong indicators of profitability performance, which also depicts the ability of Nike Inc in creating more earnings with the help of their revenue of the business. Moreover, the ROCE ratio of the entity was 30.11 in 2019 and 13.51 in 2020 that of the GP ratio was 44.67 in 2019 and 43.42 in 2020. The percentages of both the ratios show a fall in profitability position in 2020 in comparison to 21019 (Suvvari et al. 2019). This is because the creation of income has been declined in proportion to the revenue and capital employed of the firm. As for this, it is a negative warning for the business which would affect the overall profitability position of the firm in the future years.
Efficiency Ratios
| Calculation of Debtors collection period | ||||
| 2020 | 2019 | |||
| Collection period | 26.83 | 39.86 | ||
| Receivables | $ 2,749.00 | $ 4,272.00 | ||
| Revenue | $ 37,403.00 | $ 39,117.00 | ||
Table 5: Collection period (Source: S1.q4cdn.com, 2020)
| Calculation of Creditors payment period | ||||
| 2020 | 2019 | |||
| Payment period | 10.62 | 12.07 | ||
| Payables | $ 2,248.00 | $ 2,612.00 | ||
| Cost of sales | $ 21,162.00 | $ 21,643.00 | ||
Table 6: Payment period (Source: S1.q4cdn.com, 2020)
Illustration
The collection and payment period of business is one of the strong indicators of profitability performance of Nike Inc. This is because it shows the efficiency of their receivables and payables in the collection and payment of business debts (Tenney and Kalenkoski, 2019). Moreover, the collection period of Nike Inc was 39.86 in 2019 and 26.83 in 2020 that of 12.07 in 2019 and 10.62 in 2020. The effectiveness and efficiency performance of the company is quite satisfactory since the collection and payment period was declined in 2020 in comparison to 2019. This means the company now collects and pays their debts efficiently and rapidly, which would be helpful for them in creating more funds in the business. Therefore, a lower collection and payment period is a positive sign for the firm by which they attract more suppliers in business since they possess a low payment period.
Shareholders Ratios
| Calculation of Gearing ratio | ||||
| 2020 | 2019 | |||
| Gearing ratio | 2.89 | 1.62 | ||
| Total debt | $ 23,287.00 | $ 14,677.00 | ||
| Total equity | $ 8,055.00 | $ 9,040.00 | ||
Table 7: Gearing ratio (Source: S1.q4cdn.com, 2020)
| Calculation of Price-earnings ratio | ||||
| 2020 | 2019 | |||
| P/E ratio | 62.31 | 28.76 | ||
| Share price | $ 101.57 | $ 73.34 | ||
| EPS | $ 1.63 | $ 2.55 | ||
Table 8: P/E ratio (Source: S1.q4cdn.com, 2020)
Illustration
The computation of shareholders ratios is significantly important for Nike Inc for reflecting whether or not to buy the share capital of Nike Inc. The above-calculated ratios also show the risk position of their business along with the share price of the firm. The P/E ratio of the company was 28.76 in 2019 and 62.31 in 2020 that of the gearing ratio was 1.62 in 2019 and 2.89 in 2020. The gearing ratio portrays that the risk position of the business is high since the debt capital is far greater than the equity capital of the business (Wijaya et al. 2021). Therefore, an increase in risk positive can impact the returns provided by Nike Inc to their investors. However, the P/E ratio shows a satisfactory performance of the firm since it depicts a massive enhancement in the share price of 2020 in comparison to 2019. This is a positive symbol for them by which they can undertake a large part of the sports market.
4. Evaluation of financial performance along with management accounting recommendations
The financial performance of the organisation is estimated through gross profit margin, net profit margin, working capital, current ratio, debt to equity ratio and inventory turnover. Evaluation of the financial performance is enormously important as it portrays the investor about the general well-being which is a snapshot of the management job and economic health (Bendickson. and Chandler, 2019). Based on the analysis of liquidity ratios, it can be stated that the Profitability ratio, investors and efficiency ratio of the organisation is relatively less which impacted the yearning revenue of the organisation. The ratio of gross profit in the profitability ratio will reflect that the gross profit is less in 2020 as compared to 2019 which has a significant impact on earning revenue of the organisation (Nike.com, 2022). In the calculation of debtors’ collection period, it is reflected that the collection period in 2020 is estimated at 26.83 which is comparatively less than 2019. The shareholder ratio of this organisation has been geared up by 2.89 in 2020 which is estimated as 1.62 in 2019.
Recommendations
- Latif et al. (2020) stated that in the management accounting and increasing the revenue yearning of the company, Nike must have the sub-optimal O2C accounting processes of operation
- Nike Must have been a partnership of Blackline with SAP which is extremely important for them to have the techniques and tools that are integrated with the modulus and platforms of SAP to provide a more holistic solution (Rodriguez-Gomez et al. 2020).
- Nike must ensure the completeness of the balance sheet with accuracy and standardise and centralise the close of mouth-end.
- Rikhardsson and Yigitbasioglu (2018) opined that this largest sportswear brand must unify the accounting of intercompany for global alignment and automatic processes manually and optimise time in managing the accounting.
- Nike must automate the close activities of SAP, accelerate the collection of cash and focus on optimising the working capital (Malagila et al. 2021).
5. Conclusion
Based on the above study, it can be concluded that Nike has maintained its brand reputation through unique manufacturing processes in the potential market and holds a competitive advantage over its rivalries. This largest sportswear manufacturing organisation consistently focuses on the priorities of the customer to enhance the sales process and earn profitability of the organisation. The performance of Nike in terms of stakeholder and market performance are critically evaluated. The financial performance of the organisation is immensely stable which follows the bottom-line approach and the earning revenue and size of the company have been stated thoroughly in the study. The issues of the company have been recognised through a financial analysis ratio whose recommendation on managing the accounting factor has been provided for the organisation.
References
Journals
Anis, A., 2020. Financial performance, disparity, and trend of petrochemicals sector of Saudi Arabia. Entrepreneurship and Sustainability Issues, 8(1), pp. 809-824.
Bendickson, J.S. and Chandler, T.D., 2019. Operational performance: The mediator between human capital developmental programs and financial performance. Journal of Business Research, 94, pp.162-171.
da Silva, E.C. and Las Casas, A.L., 2020. Key elements of sports marketing activities for sports events. International Journal of Business Administration, 11(1), pp.11-21.
Dar, I.A. and Mishra, M., 2020. Dimensional impact of social capital on financial performance of SMEs. The Journal of Entrepreneurship, 29(1), pp.38-52.
Escamilla-Fajardo, P., Alguacil, M. and Gómez-Tafalla, A.M., 2021. Effects of entrepreneurial orientation and passion for work on performance variables in sports clubs. Sustainability, 13(5), p.2920.
Fusco, F. and Migliaccio, G., 2018. Crisis, sectoral and geographical factors: financial dynamics of Italian cooperatives. EuroMed Journal of Business, 13(2), pp. 130-148.
Gong, P., 2020. The Financial Analysis of Public Company in Stock Exchange Mergers Ratio. Journal of Physics: Conference Series, 1549(5),.
Kemp, S., Cowie, C.M., Gillett, M., Higgins, R., Hill, J., Iqbal, Z., Jackson, P., Jaques, R., Larkin, J., Phillips, G. and Peirce, N., 2021. Sports medicine leaders working with government and public health to plan a ‘return-to-sport’during the COVID-19 pandemic: the UK’s collaborative five-stage model for elite sport. British journal of sports medicine, 55(1), pp.4-5.
Krylov, S., 2018. Target financial forecasting as an instrument to improve company financial health. Cogent Business & Management, 5(1),.
Latif, B., Mahmood, Z., Tze San, O., Mohd Said, R. and Bakhsh, A., 2020. Coercive, normative and mimetic pressures as drivers of environmental management accounting adoption. Sustainability, 12(11), p.4506.
Malagila, J.K., Zalata, A.M., Ntim, C.G. and Elamer, A.A., 2021. Corporate governance and performance in sports organisations: The case of UK premier leagues. International Journal of Finance & Economics, 26(2), pp.2517-2537.
Quinn, M., Hiebl, M.R., Moores, K. and Craig, J.B., 2018. Future research on management accounting and control in family firms: suggestions linked to architecture, governance, entrepreneurship and stewardship. Journal of Management Control, 28(4), pp.529-546.
Rikhardsson, P. and Yigitbasioglu, O., 2018. Business intelligence & analytics in management accounting research: Status and future focus. International Journal of Accounting Information Systems, 29, pp.37-58.
Rodriguez-Gomez, S., Arco-Castro, M.L., Lopez-Perez, M.V. and Rodríguez-Ariza, L., 2020. Where does CSR come from and where does it go? A review of the state of the art. Administrative Sciences, 10(3), p.60.
Summerley, R., 2020. The development of sports: A comparative analysis of the early institutionalization of traditional sports and e-sports. Games and Culture, 15(1), pp.51-72.
Suvvari, A., Raja Sethu Durai, S. and Goyari, P., 2019. Financial performance assessment using Grey relational analysis (GRA): An application to life insurance companies in India. Grey Systems, 9(4), pp. 502-516.
Tenney, J.A. and Kalenkoski, C.M., 2019. Financial Ratios and Financial Satisfaction: Exploring Associations Between Objective and Subjective Measures of Financial Well-Being Among Older Americans. Journal of Financial Counseling and Planning, 30(2), pp. 231-243.
Wijaya, J.H., Assaum, A.S. and Assidik, D.M., 2021. Analysis Of Financial Value With The Measurement Of Financial Ratios In Companies Jointed In The Multiple Industrial Sector. Turkish Journal of Computer and Mathematics Education, 12(8), pp. 343-346.
Website
Cnbc.com, 2022, About Us, Available from: https://www.cnbc.com/2021/12/20/nike-nke-q2-2022-earnings.html [Accessed on: 17th February 2022]
Macrotrends.net, 2022, About Us, Available from: https://www.macrotrends.net/stocks/charts/NKE/nike/revenue [Accessed on: 17th February 2022]
Nike.com, 2022, About Us, Available from: https://news.nike.com/news/nike-inc-reports-fiscal-2021-fourth-quarter-and-full-year-results [Accessed on: 17th February 2022]
Nike.com, 2022, About Us, Available from: https://www.nike.com/in/ [Accessed on: 17th February 2022]
S1.q4cdn.com, 2020, Overview, Viewed on 16th February 2021https://s1.q4cdn.com/806093406/files/doc_financials/2020/ar/363224(1)_16_Nike-Inc_Combo_WR_R2.pdf
Statista.com, 2022, About Us, Available from: https://www.statista.com/statistics/243199/number-of-employees-of-nike-worldwide/ [Accessed on: 17th February 2022]
Know more about UniqueSubmission’s other writing services:
