
Business Analytics and Statistics
This business report outlines problem faced by Good Harvest at an initial stage of business cycle. Good Harvest is operating business in second year and also operating its business in different areas and segments like wholesale delivering system, retail store and Harvest Kitchen. In addition, company grows and delivers the customers with organic food products. The main challenges which company face is increase & decrease in the sales, revenue and profit. Good Harvest operates business efficiently as company has 1 delivery van, 1 retail store, a cold warehouse store and most important 6 sales persons to handle customers (Good Harvest, 2017). The top selling products of Good Harvest is fruits, vegetables, dry fruits and many more whereas worst selling and demanded products are pastas, juices & fridge and so on. This report will highlights on different problems and also try to identify the change in sales & profit performance of the company in the competitive environment. Further, some recommendations will also be provided to Good Harvest CEO so that he can take major important decisions for improvement and development of business.


Problem definition and required business intelligence
Good Harvest is facing problem in managing its increase or decrease in sales & profit in different situations. The below states following question will helps in reaching to the result and also help in understanding the reason behind change in company’s performance and customer buying behavior:
Q1: What are the top/worst selling products in terms of sales?
- Is there a difference in payments methods?
Q2: Are the differences in sales performance based on where the product is located in the shop? How does this effect both profits and revenue?
Q3: Is there a difference in sales and gross profits between different months of the year?
Q4: Are their differences in sales performance between different seasons?
- How does this relate to rainfall and profits?
Extra questions:
Q5. Identify the difference in average sales in different months of the year?
Q6. Identify whether difference in gross profit is due to different seasons?
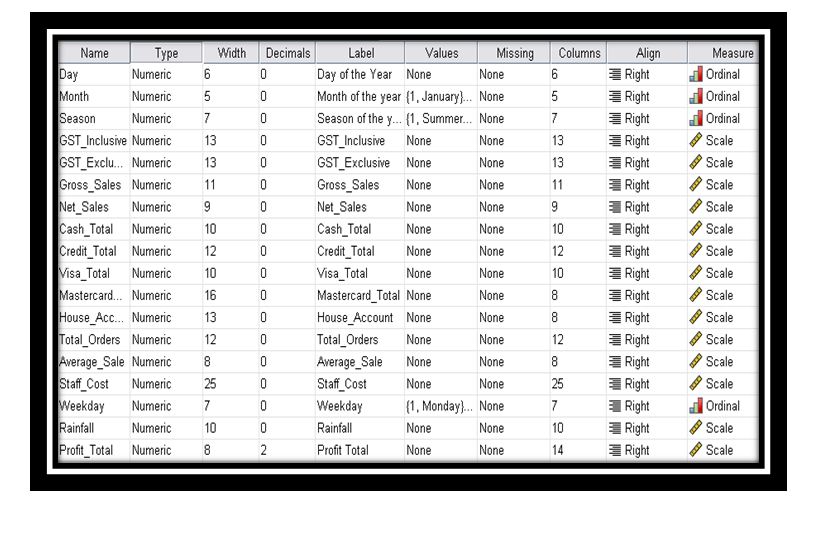
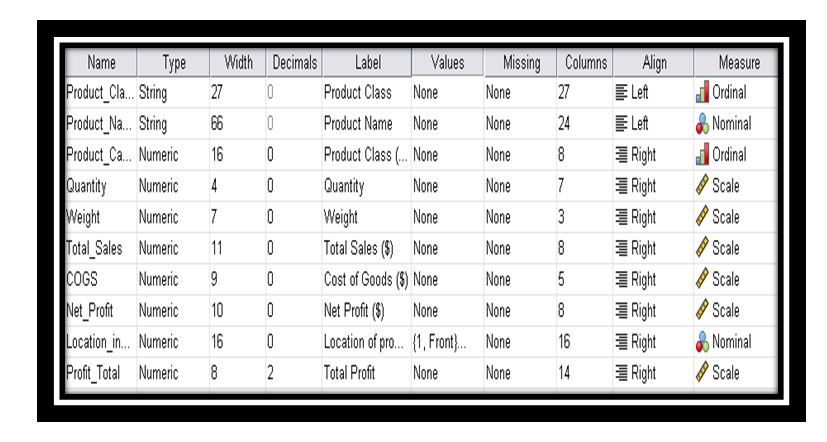
In addition, sales data mix and product data mix set is also developed with the help of SPSS software which help in analyzing the data more efficiently and effectively:
Visualization of the Descriptive Statistics
Under this, descriptive statistics study is conducted in which two different data set categories are developed i.e., sales data and product data.
Table 1: Descriptive statistics study of Sales Data Mix
| Descriptive Statistics | ||||||
| N | Minimum | Maximum | Sum | Mean | Std. Deviation | |
| Day of the Year | 366 | 1 | 366 | 67161 | 183.50 | 105.799 |
| Month of the year | 366 | 1 | 12 | 2384 | 6.51 | 3.456 |
| Season of the year | 366 | 1 | 4 | 915 | 2.50 | 1.117 |
| GST Inclusive | 366 | 0 | 271 | 41876 | 114.42 | 48.723 |
| GST Exclusive | 366 | 0 | 2492 | 340583 | 930.56 | 303.827 |
| Gross Sales | 366 | 0 | 2642 | 382460 | 1044.97 | 326.285 |
| Net Sales | 366 | 0 | 2370 | 371220 | 1014.26 | 313.986 |
| Cash Total | 366 | 0 | 1195 | 147969 | 404.29 | 153.643 |
| Credit Total | 366 | 0 | 1407 | 214036 | 584.80 | 228.860 |
| Visa Total | 366 | 0 | 1407 | 203441 | 555.85 | 244.870 |
| MasterCard Total | 366 | 0 | 399 | 8086 | 22.09 | 67.823 |
| House Account | 366 | -264 | 1113 | 13684 | 37.39 | 113.204 |
| Total Orders | 366 | 0 | 129 | 20327 | 55.54 | 15.844 |
| Average Sale | 358 | 8 | 61 | 6631 | 18.52 | 3.985 |
| Staff Cost | 366 | 170 | 351 | 91022 | 248.69 | 52.418 |
| Weekday | 366 | 1 | 7 | 1463 | 4.00 | 1.998 |
| Rainfall | 365 | 0 | 63 | 1452 | 3.98 | 9.811 |
| Profit Total | 366 | -33.98 | 271.97 | 1.12E4 | 30.7098 | 30.05661 |
| Valid N (listwise) | 357 | |||||
Table 2: Descriptive statistics study on Product Data Mix
| Descriptive Statistics | ||||||
| N | Minimum | Maximum | Sum | Mean | Std. Deviation | |
| Product Class (number) | 1034 | 1 | 30 | 15464 | 14.96 | 8.515 |
| Quantity | 1034 | 1 | 3769 | 74348 | 71.90 | 212.400 |
| Weight | 209 | 0 | 2913 | 16156 | 77.30 | 242.323 |
| Total Sales ($) | 1034 | 0 | 17276 | 382540 | 369.96 | 1014.719 |
| Cost of Goods ($) | 1034 | 0 | 8573 | 212203 | 205.22 | 561.072 |
| Net Profit ($) | 1034 | 0 | 8703 | 170338 | 164.74 | 482.106 |
| Location of product in shop | 1034 | 1 | 5 | 3218 | 3.11 | 1.526 |
| Total Profit | 1034 | .00 | 8702.93 | 1.70E5 | 1.6473E2 | 482.10651 |
| Valid N (listwise) | 209 | |||||
Selected Data Analytical Method & Discuss Technical Analysis
In this part, the analysis and discussion will be done on the basis of above defined problem. These are as follows:-
Question 1: What are the top/worst selling products in terms of sales?
Answers: the Pareto principle is implemented for analysing the problem. Basically, Pareto principle is considered as an 80/20 rule which states 20% invested input is responsible for 80% of consequences. Based on this, it is find that good harvest grows which product line is on the top selling category or which one comes under worst. In regards to this, the Pareto curve shows the product class and total sales etc.
Figure indicates that Pareto curve which defines the 80/20% rule principle. On Y axis represents the total sales of 80% while X axis shows the product class and the intersection of this provides the top selling products of Good harvest grows. The left on X axis is the worst products. Thus, based on this graph, the top selling products are the dairy & bakery products, chocolates, dry goods, snacks, fruit, vegetables etc. While remaining products which come under 20% are the grocery, spices, ayurvedic, grocery, freezer, fridge etc (Zhang, et al., 2015). thus, such practices indicates that 20% of worst product have an negative impact on the total sales of enterprise.
- Is there a difference in payments methods?
In relation to this, T-test will be use for finding the differences in payment method which are as follows:-
Table 3: T-test payment method
T-test provides the P-value. It is that value which calculate the profitability through finding the observed and when the null hypothesis is true then there is no significant differences is find out. Similarly, p-value for the variables is 0 and it is less than the cut off value which is 0.05. This means that it is differences in payment method of Harvest grow.
| One-Sample Test | ||||||
| Test Value = 0 | ||||||
| t | df | Sig. (2-tailed) | Mean Difference | 95% Confidence Interval of the Difference | ||
| Lower | Upper | |||||
| Cash Total | 50.340 | 365 | .000 | 404.287 | 388.49 | 420.08 |
| Credit Total | 48.885 | 365 | .000 | 584.798 | 561.27 | 608.32 |
| Visa Total | 43.427 | 365 | .000 | 555.849 | 530.68 | 581.02 |
| MasterCard Total | 6.232 | 365 | .000 | 22.094 | 15.12 | 29.07 |
| House Account | 6.318 | 365 | .000 | 37.388 | 25.75 | 49.02 |
Question 2: Are the differences in sales performance based on where the product is located in the shop? How does this affect both profits and revenue?
Answer: To know impact of sales performances with the location of product, Pareto curve is used by the analyst.
Graph 2: Pareto curve for sales performances with product location
This curve shows the differences in sales performances with the displaying location of products in shop. Based on this curve, it is find that product which located at rear location have high selling comparatively to the product which displayed at outside of store (Fuoco, et al., 2014). So the outside products have generated revenue with $40612 and high selling product has $96493 revenue.
Furthermore, Pareto curve shows the relationship of total profit and product locations
Graph 3: Pareto curve for total profit and product display location
This depicts that rear located product like bakery and dairy items are earned more profits as compare to products which placed at outside of store such as freezers, frizzes, spices etc. Thus, it can be stated that location has a deep impact on the total profits, revenue and sales.
Question 3: Is there a difference in sales and gross profits between different months of the year?
Answer: ANOVA test is used for presenting the regression analysis of sales, gross profit of different months in a year.
Table 4: Regression for analyzing sales in different months
The regression depicts the value of P which is 0.221. It is greater than 0. This signifies that no variation exist in sales of different months in a year. Moreover, ANOVA test is used to find gross profit between months in a year.
Table 5: ANOVA test for profits in different months
The table indicates that there is a difference in gross profit in different months of years.
P-value is 0 which is less than the cut off value and that’s means alternative hypothesis is accepted. From this, it is stated that there is differences exist in the profit of different months in a year.
Question 4: Are there differences in sales performance between different seasons?
Answer: To estimate the sales performances between different seasons, Regression analysis is used by the researcher in order to take right decision for the issues/ problem which is faced by the Good Harvest Grows.
Table 6: Regression analysis for sales in different seasons
The regression shows the P-value which is 0.153 and it is considered as a high than the 0.05. So, no significant differences exist of sales in different seasons.
- How does this relate to rainfall and profits?
Table 7: Correlation between rainfall and profits
As per the above table, no significant relationship exist between the rainfall and profits so the rainfall or profits also does not relate with each other. P value is 0.008 which less than the 0.05. So it shows the positive correlation but insignificant. This describe that rainfall have no correlation with profit. Other than that, in case any changes in season then it does not have any impact on the company ability to earn profit (Leech, et al., 2014).
Additional questions:
Q5. Identify the difference in average sales in different months of the year?
Answer 5: For identifying difference in average sales of each month, ANOVA table is used and prepared:
Table 8: ANOVA table (average sales)
From the above ANOVA table, it can be determined easily that average sales of company is not different in different seasons because there are some products which are required in every seasons by the customers so that customers meet their daily needs and demands (Larson-Hall, 2015). This result is obtained as p-value is .176 which is more than the actual significance value 0.05 (0.176>0.05).
Q6. Identify whether difference in gross profit is due to different seasons?
Answer 6: In order to identify whether different seasons have impact on difference in gross profit of the company, regression analysis test is conducted under which ANOVA table is developed:
Table 9: ANOVA table (gross profit)
The result attained from above ANOVA table is that company is facing problem because in different seasons affects the gross profit of the company to large extent because there are some products which are less demanded in winter season and vice-versa in case of summer season (Aravkin, et al., 2013). This result depicts that computed p-value is zero which denotes that null hypothesis is rejected and this indicates that company generates different gross profit in every seasons like summer and winter.
Result Discussion and Recommendation
The above result discusses & summarizes that Good Harvest are providing customers with different range of organic products but at the same time, company products are divided into two selling categories i.e., top selling products and worst selling products. During analysis, it is found that there are some products which are located at rear and front side of shop and those products are considered under top selling products like fruits & vegetables, etc. On the other side, there are worst selling products like fridge, pastas, etc which are kept at left and right side of store location and these products are unseen by company’s customers. While studying and analyzing the data set, it is understandable that company has less impact or influence over sales, profit and revenue from different seasons and product location in shop.
At the same time, some recommendations are provided to Good Harvest for overcoming business problem i.e., difference in sales and profit in different seasons or not. For this, company need to focus on the areas or locations where its keeps their worst selling products i.e., company need to switch the location of products so that customers purchase products which are unseen earlier. In addition, Good Harvest is required to open more retail stores at different location plus hire more sales person who are able and capable to attract and convince customer to purchase goods & services. Thus, these recommendations will help Good Harvest to develop & grow its business to next level as well as helps in understanding the customer buying behavior in different months or seasons through sales performance and profit.
Aravkin, A. Y., Kumar, R., Mansour, H., Recht, B., & Herrmann, F. J. (2013). An SVD-free Pareto curve approach to rank minimization. arXiv preprint arXiv:1302.4886.
Fuoco, F. C., Buonanno, G., Stabile, L., & Vigo, P. (2014). Influential parameters on particle concentration and size distribution in the mainstream of e-cigarettes. Environmental Pollution, 184, 523-529.
Good Harvest (2017). Retrieved from: http://www.goodharvest.com.au
Larson-Hall, J. (2015). A guide to doing statistics in second language research using SPSS and R. UK: Routledge.
Leech, N. L., Barrett, K. C., & Morgan, G. A. (2014). IBM SPSS for intermediate statistics: Use and interpretation. UK: Routledge.
Zhang, D., Evangelisti, S., Lettieri, P., & Papageorgiou, L. G. (2015). Energy consumption scheduling of smart homes with microgrid under multi-objective optimization. In 12th International Symposium on Process Systems Engineering and 25th European Symposium on Computer Aided Process Engineering, Copenhagen, Denmark (Vol. 31).
