Trading Economics Assignment Sample
Introduction
Almost every country in the world has suffered to manage political, financial, social, and economic condition of their country. Major crises that have affected the UK during pandemics period will be evaluated in this study to understand their impact. Development policies of the UK will be evaluated in this study to measure the effectiveness of monetary and fiscal policies that are taken by government. Crisis has been seen in the UK in trading economics during the period of Covid 19.
Background of country
Development policies of UK
The UK is a developed country with almost 95.9% of GDP in the year 2020 and its GDP rank is 5th all over the world. The UK’s economy is stable and Human development index is high in this country. As cited by Johnson et al. (2020), quality of life is high in UK’s people because of its diversified economy free asset ratio is a unique law of the UK that promotes business industries. The UK is famous for engagement of society in international business and quality environments. Poverty reduction and growth of per capita income is the main goal of this country and it is one of the most developed countries in the world. The Covid situation has affected the world in terms of poverty that the GDP of countries has fall down to a greater extent during this period. Infrastructure of the UK supports entrepreneurs that reduce unemployment in the country. The main source of income of this country is tourism, service, construction, and manufacturing.
Chosen crisis for comparative analysis

1918-1919 Spanish Flu and 1919-1926 Depression
Spanish flu affected almost 500 million during 1918-1919 and most of the infected people have died due to lack of medical support. Unemployment increased immediately during 1919 and the economy fell by -9.7% in 1921(Case study). This recession has impacted the war and political conditions have collapsed during this period. GDP of the UK will fall by -2 % in 2020 but the UK is able to manage its pandemic situation by maintaining the government protocols. Technologies developed during this period have supported the business industry to create sustainable sources of operating business and earning money.
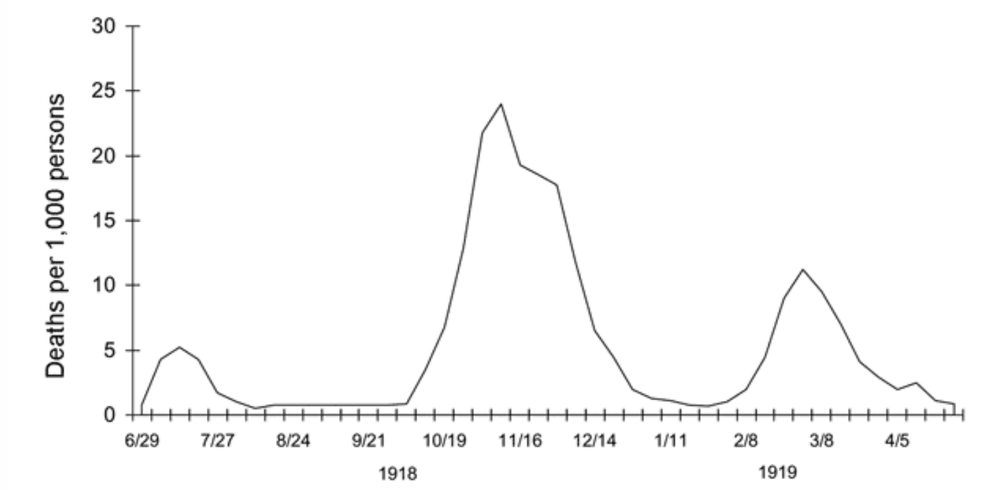
Figure 1: 1918-1919 Spanish Flu
(Source: theconversation.com, 2021)
Crisis due to Covid-19
The pandemic has infected more than 500 million people and the main effect of this crisis is price rise of every essential product. Economy has fallen from the COVID-19 situation and unemployment has increased at the preliminary stage. As cited by Daly Sutin & Robinson (2020), COVID-19 has spread all over the world and people are isolated in their homes due to fear of infection. In post pandemic situations companies have taken new policies to operate work and have found sustainable supply chains that are effective in a crisis. It has affected the complete supply chain management system in various countries along with the UK.
1930s Great Depression
Export business has been stopped during 1931 in the UK and a large amount of loss has been faced by the UK government because international business is the main source of income of the UK. GDP growth rate has decreased by almost 4.6 % but whole economy has fallen around -0.8 % for this great depression. Lockdown approximately 10 years are taken by the UK government to recover its normal economic condition and reduce unemployment.
A large number of small business organizations have shut down due to lack of finance because most of the investors have withdrawn their investment due to regular loss of business. Countries have increased their exchange rate because of inflation in currency. A lot of people have suffered from hypertension for staying in isolation for a long time and poverty has increased because of this pandemic.
Mid 1970s Recessions
Recession of 1970 has increased inflation continuously due to the oil crisis, termination of traditional British industry, stagflation, and lack of production. Average inflation was almost 16 % in 1974 GDP growth of UK has decreased by -1.5%. Miners have struck during this period for an unexpected increasing rate of inflation (Case study). The UK lost the momentum of reduction of poverty during the 1970 Recession. Inflation rate is almost 0.7% during pandemic and unemployment has increased by 9 %. As opined by O’Donovan (2020), a lot of employees have lost their lives during this pandemic situation and a large number of workers are fired because e companies are unable to pay their dues.
1980s recession
Inflation has increased by almost 18 % during 1980s recession and GDP has fallen by -2 %. Companies’ earnings have decreased by almost 35% (Case study). Borrowing cost has increased by financial institutions due to high exchange rates all over the country. Almost 11.9 % of working people have lost their jobs during this recession. As cited by Goode Stroup & Gaufman (2020), unemployment has increased after this period because the UK government was unable to recover its stable economy for different political issues. A large number of employees are in a pandemic situation because national and international trade has collapsed.
Companies have found sustainable robotic technology that is more efficient than human resources that have decreased employment. As cited by Samonikov & Veselinova (2020), it will be hard to recover those people who are suffering from poverty in a pandemic situation because digital machines are implemented against those employees. Demand will be high in upcoming years of a post-pandemic situation but companies will produce products at a low cost but a large number of people will be unable to purchase goods and services from them due to lack of employment.
1990s recession
Budget deficit was seen for the first time in economy of the UK in the year 1990. Cut of interest rates is prevented by the Exchange rate mechanism, where unemployment has been raised by 6.9 % of working population. Companies average earnings have decreased by almost 25% compared to previous years.
Annual inflation is almost 9.5 % in 1990 and companies have faced a large amount of loss n during this situation. During the pandemic situation demand is high and supply is also high but people are suffering from a financial crisis that has decreased the business and employment opportunities in post-pandemic situation. Financial crisis is one of the biggest effects that have been created due to the impact of Covid-19. Hence, people seek for better opportunities to improve their employment status in this tough situation. As opined by Landman & Splendore (2020), price of regular consumable goods has increased because consumer demand has changed to daily essential that helps to improve immunity of human body. Tourism industry has lost a large amount of money because of lack of transportation and protocols set by the government. Almost 4 million working people are unemployed during first wave of COVID-19.
2008/09 financial crisis
Debt crisis in US and UK in the year 2008 has led to price rise in global commodities. GDP of UK has decreased by -0.3 % in 2008 and -4.2% during the year 2009. As opined by Braun Krampf & Murau (2021), employment has impacted this country but it has recovered immediately with the development of an economy. COVID-19 has impacted the global economy and most of the countries have suffered from a lack of financial resources. A large amount of money is invested for vaccination process of a country that it will take more time to recover employment and economy.
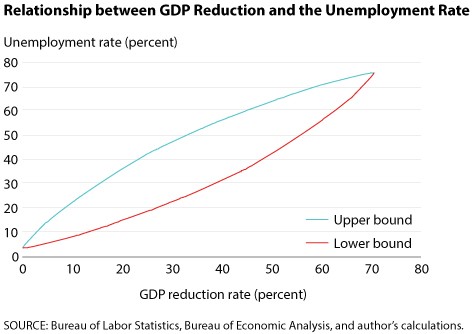
Figure 2: GDP vs Unemployment
(Source: research.stlouisfed.org, 2020)
Evaluation and Analysis
Household debt in early 1990 recession was almost 11414 million GBP but at the end of 2009 during financial crisis, it was -2379 million GBP. After comparing different crises of different periods it has been found that most of the crisis has spread few countries and there is the least impact on global economy than COVID-19. Unemployment is the most during great depression in the year 1930-1931. As opined by Fernández et al. (2020), inflation rate has increased the most during 1970 recession and contribution of public sector debt to GDP is high in a great depression. Net borrowing of country is highest in COVID-19 because it has consumed a large amount of money for the development of healthcare facilities.
Monetary and fiscal policies of Government
Interest rate is determined by banks and a committee is incorporated to develop a monetary policy of government. As cited by Afonso Alves & Balhote (2019), main objective of monetary policy of the UK government is to maintain the inflation rate that is necessary for the development of commerce and economy. Official rate is published by government and it varies based on different regions of country. As opined by Mishchenko et al. (2019), official rate of products that are imposed by the UK government is based on the domestic and external environment of different regions. This plan helps to reduce the risk of financial loss and maintain the growth of economy. Official price rate is the main element that affects inflation directly.
Conclusion
Based on this study it can be concluded that UK has faced a lot of complications to manage employment and growth of GDP over the years. It has been seen that borrowing is more during pandemic situations than other crises. Most of the cruises are epidemic but COVID-19 is a pandemic and has impacted economies all over the world. Consumer demand and working methods are completely changed for this pandemic period. The UK is a developed country and its economy is dependent on international trade but international trade was impacted due to lack of transportation. Based on this study it can be said that COVID-19 will take more time than other crises that are compared above because whole world has to improve its economy to develop international business.
References
Afonso, A., Alves, J., & Balhote, R. (2019). Interactions between monetary and fiscal policies. Journal of Applied Economics, 22(1), 132-151.Available at: https://www.tandfonline.com/doi/abs/10.1080/15140326.2019.1583309
Braun, B., Krampf, A., & Murau, S. (2021). Financial globalization as positive integration: monetary technocrats and the Eurodollar market in the 1970s. Review of International Political Economy, 28(4), 794-819.Available at: https://www.tandfonline.com/doi/abs/10.1080/09692290.2020.1740291
Daly, M., Sutin, A. R., & Robinson, E. (2020). Longitudinal changes in mental health and the COVID-19 pandemic: Evidence from the UK Household Longitudinal Study. Psychological medicine, 1-10.Available at: https://www.cambridge.org/core/journals/psychological-medicine/article/longitudinal-changes-in-mental-health-and-the-covid19-pandemic-evidence-from-the-uk-household-longitudinal-study/3076D6D9BA396B94D02E67FEBF7C66D8
Goode, J. P., Stroup, D. R., & Gaufman, E. (2020). Everyday nationalism in unsettled times: In search of normality during pandemic. Nationalities Papers, 1-25.Available at: https://www.cambridge.org/core/journals/nationalities-papers/article/everyday-nationalism-in-unsettled-times-in-search-of-normality-during-pandemic/2AC99C9E14C5B6D0B094194EB685CE1E
Johnson, M. T., Johnson, E. A., Webber, L., & Nettle, D. (2020). Mitigating social and economic sources of trauma: The need for universal basic income during the coronavirus pandemic. Psychological Trauma: Theory, Research, Practice, and Policy, 12(S1), S191.Available at: https://psycnet.apa.org/record/2020-42059-001
Landman, T., & Splendore, L. D. G. (2020). Pandemic democracy: elections and COVID-19. Journal of Risk Research, 23(7-8), 1060-1066.Available at: https://www.tandfonline.com/doi/abs/10.1080/13669877.2020.1765003
Mishchenko, S., Naumenkova, S., Mishchenko, V., Ivanov, V., & Lysenko, R. (2019). Growing discoordination between monetary and fiscal policies in Ukraine. Banks and Bank Systems, 14(2), 40.Available at: https://www.businessperspectives.org/images/pdf/applications/publishing/templates/article/assets/11952/BBS_2019_02_Mishchenko.pdf
O’Donovan, N. (2020). Paying for the Pandemic. Future Economies Research and Policy Paper, 8, 17.Available at: https://www.mmu.ac.uk/media/mmuacuk/content/documents/business-school/future-economies/Paying-for-the-Pandemic-ODonovan.pdf
research.stlouisfed.org, 2020, How Bad Can It Be? The Relationship between GDP Growth and the Unemployment Rate. Retrieved from: https://research.stlouisfed.org/publications/economic-synopses/2020/04/16/how-bad-can-it-be-the-relationship-between-gdp-growth-and-the-unemployment-rate
Samonikov, M. G., & Veselinova, E. (2021). Managing the monetary and fiscal efforts to alleviate the turbulence from the COVID-19 crisis in the world and in our country. Journal of Economics, 6, 30-44.Available at: https://js.ugd.edu.mk/index.php/JE/article/view/4337
theconverstaion.com, 2021, Compare the flu pandemic of 1918 and COVID-19 with caution – the past is not a prediction. Retrieved from: https://theconversation.com/compare-the-flu-pandemic-of-1918-and-covid-19-with-caution-the-past-is-not-a-prediction-138895
Appendices
Appendix 1: Growth rate of different crises
| Past Economic crisis/recessions vs Covid-19 Pandemic | ||||||||||||||||
| Macroeconomic indicator | 1918-1919 Spanish Flu | 1919–26 depression | Great depression | Mid-1970s recessions | Early 1980s recession | Early 1990s recession | t Recession (2008/09 Financial cr | Covid-19 Pandemic Recession | ||||||||
| When did it start? | The following year | When did it start? | The following year | When did it start? | The following year | When did it start? | The following year | When did it start? | The following year | When did it start? | The following year | When did it start? | The following year | When did it start? | The following year | |
| 1919 | 1920 | 1920 | 1921 | 1930 | 1931 | 1974 | 1975 | 1980 | 1981 | 1990 | 1991 | 2008 | 2009 | 2020 | 2021 | |
| GDP Growth Rate % | -7.81 | -5.79 | -5.79 | -9.71 | -0.8 | -4.64 | -2.48 | -1.47 | -2.03 | -0.79 | 0.73 | -1.1 | -0.28 | -4.25 | -14.27 | 4.61 |
| Unemployment Rate % | 6 | 3.9 | 3.9 | 16.9 | 16 | 21.3 | 3.7 | 4.5 | 6.8 | 9.6 | 7.1 | 8.9 | 5.7 | 7.6 | 14.8 | 11.6 |
| Inflation | 10.1 | 15.4 | 15.4 | -8.6 | -2.8 | -4.3 | 16 | 24.2 | 16.4 | 10.9 | 7 | 7.5 | 3.6 | 2.2 | 0.7 | 0.7 |
| Public sector net debt (% of GDP) | 139.94 | 132.58 | 132.58 | 159.81 | 165.7 | 176.74 | 47.78 | 49.4 | 40.41 | 40.1 | 21.71 | 22.87 | 48.79 | 62.9 | 113.17 | 114.73 |
| Public sector net borrowing (% of GDP) | 21.12 | 5.55 | 5.55 | 0.04 | 1.67 | 1.89 | 5.7 | 6.34 | 4.32 | 2.02 | 0.92 | 3.22 | 7.49 | 10.17 | 20.68 | 10.48 |
| Household Debt £m | 11413 | 8349.5 | 8587.25 | -2379.25 |
(Source: Case study)
………………………………………………………………………………………………………………………..
Know more about UniqueSubmission’s other writing services:
