ULMS876 The Strategic Management of Business Analytics Assignment Sample
Section A
Review of Contemporary literature
According to Chen et al., 2019, paper is emphasizes “Processes, benefits, and challenges for adoption of blockchain technologies in food supply chains: a thematic analysis”. In recent years, blockchain technology has attracted a lot of interest and has become increasingly popular.
Blockchain technology has the potential to improve food “supply chain management” on the sector of finance. Because the use of blockchain in “food supply chains” is still in its infancy, it is essential to have a thematic framework in order to thoroughly comprehend the procedure, its advantages, and its drawbacks.

Using a thematic analysis, the purpose of this paper is to investigate the use of blockchain technology in the “food supply chain”. Online databases, such as “news article database” and “Web of Science’s research report database”, are used for desktop research and data collection. Following “Creswell’s research methodology”, researcher then carry out a qualitative thematic analysis.
Author identify seven primary and two secondary themes for throughout the recruitment process using thematic analysis. The advantages of 14 primary, 17 secondary, and 6 tertiary subjects. There are five secondary themes and 15 primary themes in the challenge. The author also talk about and suggest ways to increase the use of blockchain technology in real-world “food supply chains”.
According to Vass et al., 2019, the paper concentrates on “IoT in Supply Chain Management: Opportunities and Challenges for Businesses in Early Industry 4.0 Context”. The global network of the smart devices known as the “Internet of Things (IoT)” connects the digital as well as physical worlds.
Although the “Internet of Things (IoT)” is regarded as a fundamental technology for the upcoming Industry 4.0 era, there is insufficient empirical evidence to support its application in “supply chain management”. Through grounded, theory-based interviews with an “Australian retail industry manager”, this study therefore investigates the advantages and disadvantages of IoT adoption in the supply chain.
NVivo-based thematic analysis demonstrates that the Internet of Things increases visibility of goods movement, data collection, partner communication, and business intelligence. Retailers, on the other hand, struggle with a lack of leadership initiative, the high cost of acquiring new technology, stakeholders’ resistance to change, data sharing, and poor interoperability between partner systems.
A “proof-of-concept of the benefits” of the “Internet of Things” to improve IoT-related investment decisions is presented in this study, as are adoption obstacles and recommendations for future research.
According to Stevenson, (2019), The retail industry has seen a major shift in the past few years, driven by the rise of digital technology and the changing habits of consumers. In particular, the emergence of e-commerce, mobile commerce, and digital payment solutions has revolutionized the way people shop and interact with retailers.
At the same time, traditional brick-and-mortar stores are struggling to keep up with these changes. Many retailers are struggling to develop an effective online presence, while others are finding it difficult to keep up with the pace of technological advancements. This has led to a decrease in sales and profitability for many retailers.
The emergence of digital technology has also increased competition in the retail industry as companies are able to quickly reach customers and offer more competitive prices. This has resulted in a decrease in margins and profits for many retailers.
Descriptive analytics with example of the retail industry
The retail industry is a dynamic industry that requires constant innovation and adaptation to customer needs. In the retail industry, a retailer sells goods or services directly to the consumer. This could be in the form of in-store, online, or mobile shopping. Retailers focus on providing customers with a variety of services, such as delivery, payment, and returns.
They also focus on building relationships with customers, offering discounts, and creating loyalty programs. Retailers must constantly be aware of consumer trends and adjust their product offerings accordingly.
For example, a clothing retailer may offer discounts on athleisure products during a health and wellness trend. Additionally, they must keep up with technological advances in order to offer customers a more efficient shopping experience. For example, a retailer may offer an app that allows customers to shop online, pick up in-store, and track their orders.
Predictive analytics with example of the retail industry
A predictive example for the retail industry would be price optimization. By leveraging predictive analytics, retailers can use past sales data to determine the optimal pricing for each product across different locations and times.
This way, retailers can maximize revenue by setting prices that are most attractive to customers while still generating a healthy profit margin.
Predictive analytics can be used in the retail industry to create more targeted marketing campaigns, personalize the customer experience, optimize pricing and promotions, forecast demand and supply, and improve inventory management.
For example, a retailer could use predictive analytics to analyze customer data, such as purchase history, location, and product preferences, in order to create tailored marketing campaigns for customers. This could include sending emails with promotional offers based on the customer’s past purchases or displaying ads for products the customer may be interested in. Predictive analytics can also be used to optimize pricing and promotions.
By analyzing past sales data, retailers can determine which products and promotions are most successful, and use this information to create more effective pricing strategies and promotions.
Finally, predictive analytics can be used to forecast demand and supply, and improve inventory management. By analyzing customer data, retailers can anticipate future demand for certain products and adjust their inventory accordingly. This can help ensure that the right products are in stock at the right time.
Prescriptive analytics example of the retail industry
Prescriptive analytics can be used in the retail industry to help retailers make informed decisions about their inventory, pricing, and marketing strategies. For example, prescriptive analytics can be used to determine the optimal pricing for items based on current market conditions or to identify the most effective promotion strategies for a particular product.
Additionally, prescriptive analytics can be used to forecast customer demand for specific items, enabling retailers to better manage their inventory and ensure they have the right items available when customers are looking for them.
The difference between classification and clustering application of the retail industry
Classification is the process of assigning labels or categories to a given set of data. The purpose of classification is to assign a label to each item in the data set. This is usually done with the goal of predicting outcomes or making decisions. In the retail industry, classification is used to identify customer segments and target them with personalized offers and discounts.
Clustering is the process of grouping data points together based on their similarity. The goal of clustering is to identify underlying patterns within the data and group items accordingly.
In the retail industry, clustering is used to group together customers with similar purchasing habits, so that retailers can offer tailored promotions and discounts to each group. Clustering is also used to identify customer segments that may not be easily identifiable by traditional classification techniques.
Section 2
A. Data technologies
In today’s increasingly competitive market, James Russon of the medium sized lamb farm in the UK must find a way to remain competitive and stay ahead of the rivals. One technological solution that could help the farm achieve this is the use of blockchain. Blockchain technology can be regarded as the distributed ledger technology that provides an immutable, secure, as well as transparent record of various transactions (Anggrainy, and Sari, 2022).http://ULMS876 The Strategic Management of Business Analytics Assignment Sample
By implementing this technology, James would be able to create a distributed ledger system that can be used to track the flow of products, information, and finances, making its operations more efficient and cost-effective. [Referred to Appendix 1]
Blockchain technology has the potential to bring multiple benefits to James’s lamb farm. By using the blockchain, James would be able to keep a detailed record of all of its transactions, including the sale and purchase of lambs, the tracking of lamb from farm to market, and any other financial activity related to the farm.
This would provide the farm with an accurate and up-to-date record of all its transactions and help the farm reduce costs by eliminating the need for manual record-keeping (Božič, and Dimovski, 2019).http://ULMS876 The Strategic Management of Business Analytics Assignment Sample The use of blockchain could also help James to streamline its supply chain and increase its operational efficiency.
By implementing a distributed ledger system, the management would be able to track the movement of lambs from farm to market in real-time, enabling farms to better manage their inventory and ensure that they can meet the demand of the clients. This would in turn make its operations more efficient and cost-effective, allowing farms to be more competitive in the market.
In addition, blockchain technology could also be used to improve the security of James’s operations. By implementing a distributed ledger system, they would be able to provide an immutable record of all its transactions, making it difficult for any malicious actors to tamper with them.
This would help the farm to ensure that its operations remain secure and that its clients’ data remains safe (Kraus, et al., 2020).http://ULMS876 The Strategic Management of Business Analytics Assignment Sample Finally, the use of blockchain technology could also help James to increase the transparency of its operations.
By implementing a distributed ledger system, they would be able to provide clients with a clear and transparent record of their transactions. This would help to build trust between farms and clients, allowing farms to form stronger relationships with them and ultimately leading to increased business opportunities.
Overall, the use of blockchain technology could help James Russon to improve the operational efficiency of medium sized lamb farms and gain a competitive edge against its rivals. By implementing a distributed ledger system, they would be able to track the flow of products, information, and finances in real-time, allowing the farm to reduce costs, streamline its supply chain, and increase the transparency and security of its operations.
All of this would help the farm to remain competitive in the market and ensure its long-term success.
B. Forecasting
i)
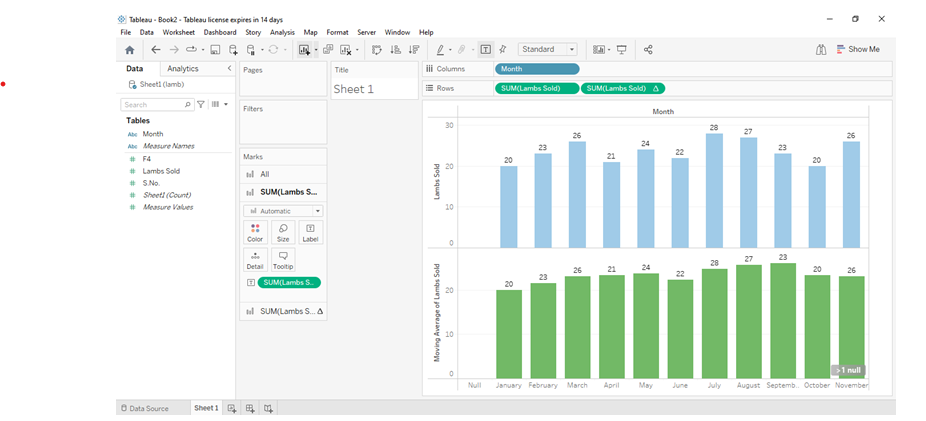
Figure 1: moving average
(Source: self-created in Tableau)
A moving average is known as the category of statistical analysis used to smooth out short-term fluctuations in data over a period of time, and to reveal the underlying trend or direction of the data. It is calculated by taking the average of a given set of data points (typically sales) over a certain number of periods such as months or years (Caseiro, and Coelho, 2019).http://ULMS876 The Strategic Management of Business Analytics Assignment Sample
Moving averages are generally used to identify trends, generate buy and sell signals, and gauge momentum. In the above figure, the moving average is displayed for the forecasting of the sales of December for the lamb farm in the UK. The moving average graph is obtained by varying the moths with the respective sales of the lamb farm situated in the UK.
From the above graph both the negative as well as the positive forecasting of the sales are experienced for the various months of the year, for December, the sales will be 24 as per the prediction obtained from the calculations of the moving average.
ii)
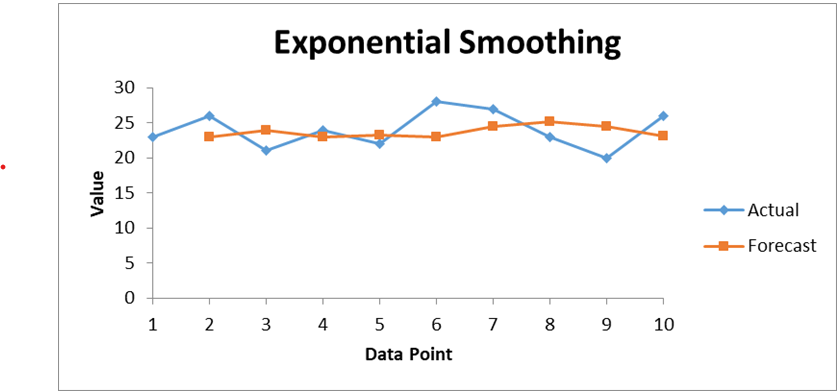
Figure 2: Exponential Smoothing
(Source: Self-created)
Exponential smoothing is known as the technique utilized for smoothing out data points by assigning exponentially decreasing weights over time. It is used for forecasting as well as prediction, and is often applied to time series data.
Exponential smoothing with alpha=0.3 is a method of forecasting that uses past values of a time series to smooth out short-term fluctuations and make predictions about the future. It uses an exponentially weighted moving average of past values to predict future values, with the weighting factor (alpha) determining how much importance is given to recent values versus past values. Alpha=0.3 gives more importance to recent values than past ones, allowing the forecast to respond more quickly to changes in the underlying data.
In the lamb farm, the forecasts are utilized for the sales where the sales of the January is the 21 and the forecasting of the sales which will be present for the December month is 23.7. The actual sales as well as the forecast sales are denoted with the blue and yellow lines.
iii)
“Mean Absolute Percentage Error (MAPE)” is a known as the measure of the prediction accuracy of the method of forecasting in statistics. It measures the size of the error in percentage terms, calculated as the “average of the absolute errors” relative to the actual values (Jena, 2019).http://ULMS876 The Strategic Management of Business Analytics Assignment Sample The value of the MAPE which is obtained from the moving average is calculated here and the value of the MAPE is also calculated by the utilization of the exponential smoothing.
It is clearly demonstrated that the value of the error at least in the exponential smoothing for the value of alpha is 0.3 which can also be demonstrated as by utilizing the exponential smoothing the forecasting can be done more effectively and accurately than the forecasting with the techniques of moving average.
Critical review of Retail industry
The retail industry has seen a major shift in the past few years, driven by the rise of digital technology and the changing habits of consumers. In particular, the emergence of e-commerce, mobile commerce, and digital payment solutions have revolutionized the way people shop and interact with retailers.
At the same time, traditional brick-and-mortar stores are struggling to keep up with these changes.
Many retailers are struggling to develop an effective online presence, while others are finding it difficult to keep up with the pace of technological advancements. This has led to a decrease in sales and profitability for many retailers.
The emergence of digital technology has also increased competition in the retail industry as companies are able to quickly reach customers and offer more competitive prices.
This has resulted in a decrease in margins and profits for many retailers. Additionally, the increased competition has led to a decrease in customer loyalty as customers are exposed to more options and are more likely to switch to the lowest-price options.
Finally, the retail industry is also facing a number of challenges related to sustainability. Many companies are struggling to reduce their environmental impact and are looking for ways to become more sustainable.
This has led to increased demand for sustainable products and services from retailers.
Strengths and difficulties
Strengths of retail industry
- Low barriers to entry: The retail industry is one of the most accessible industries to start a business in. It requires relatively small capital investments, and can be up and running quickly with the right strategy.
- Flexibility: Retail businesses offer a great deal of flexibility and can be adapted to fit a variety of markets and consumer needs.
- High consumer demand: Retail businesses can capitalize on consumer demand for products, as long as their offerings meet the needs of their customers.
- Low overhead: Retail businesses typically require minimal overhead costs, as many don’t need to rent office or warehouse space.
Weakness of retail industry
- High competition:The retail industry is highly competitive and there are always new entrants entering the market. Companies must constantly innovate and differentiate themselves in order to survive.
- Low profit margins: Retailers typically have low profit margins due to the need to keep prices competitive. This means that there is little room for error and retailers must be efficient and cost-conscious in order to stay profitable.
- Increasing employee costs: The retail industry is labor-intensive and employee costs are increasing due to minimum wage hikes and other labor regulations. This can be a major challenge for retailers who are trying to keep their costs low.
- Shifting consumer trends: Consumers are always changing their habits and preferences, and retailers must stay ahead of the curve to remain relevant. This can be challenging for retailers as they have to constantly adjust their strategies to meet changing consumer demands.
Descriptive example of retail industry
Retail industry is a dynamic industry that requires constant innovation and adaptation to customer needs. In the retail industry, a retailer sells goods or services directly to the consumer. This could be in the form of in-store, online, or mobile shopping. Retailers focus on providing customers with a variety of services, such as delivery, payment, and returns.
They also focus on building relationships with customers, offering discounts, and creating loyalty programs. Retailers must constantly be aware of consumer trends and adjust their product offerings accordingly.
For example, a clothing retailer may offer discounts on athleisure products during a health and wellness trend. Additionally, they must keep up with technological advances in order to offer customers a more efficient shopping experience. For example, a retailer may offer an app that allows customers to shop online, pick up in-store, and track their orders.
Predictive example of retail industry
A predictive example for the retail industry would be price optimization. By leveraging predictive analytics, retailers can use past sales data to determine the optimal pricing for each product across different locations and times.
This way, retailers can maximize revenue by setting prices that are most attractive to customers while still generating a healthy profit margin.
Predictive analytics can be used in the retail industry to create more targeted marketing campaigns, personalize the customer experience, optimize pricing and promotions, forecast demand and supply, and improve inventory management.
For example, a retailer could use predictive analytics to analyze customer data, such as purchase history, location, and product preferences, in order to create tailored marketing campaigns for customers.
This could include sending emails with promotional offers based on the customer’s past purchases, or displaying ads for products the customer may be interested in.
Predictive analytics can also be used to optimize pricing and promotions. By analyzing past sales data, retailers can determine which products and promotions are most successful, and use this information to create more effective pricing strategies and promotions.
Finally, predictive analytics can be used to forecast demand and supply, and improve inventory management. By analyzing customer data, retailers can anticipate future demand for certain products and adjust their inventory accordingly. This can help ensure that the right products are in stock at the right time.
Prescriptive analytics example of retail industry
Prescriptive analytics can be used in the retail industry to help retailers make informed decisions about their inventory, pricing, and marketing strategies. For example, prescriptive analytics can be used to determine the optimal pricing for items based on current market conditions, or to identify the most effective promotion strategies for a particular product.
Additionally, prescriptive analytics can be used to forecast customer demand for specific items, enabling retailers to better manage their inventory and ensure they have the right items available when customers are looking for them.
Discuss the difference between classification and clustering application of retail industry
Classification is the process of assigning labels or categories to a given set of data. The purpose of classification is to assign a label to each item in the data set.
This is usually done with the goal of predicting outcomes or making decisions. In the retail industry, classification is used to identify customer segments and target them with personalized offers and discounts.
Clustering is the process of grouping data points together based on their similarity. The goal of clustering is to identify underlying patterns within the data and group items accordingly.
In the retail industry, clustering is used to group together customers with similar purchasing habits, so that retailers can offer tailored promotions and discounts to each group. Clustering is also used to identify customer segments that may not be easily identifiable by traditional classification techniques.
Reference List
Journals
Ain, N., Vaia, G., DeLone, W.H. and Waheed, M., 2019. Two decades of research on business intelligence system adoption, utilization and success–A systematic literature review. Decision Support Systems, 125, p.113113.
Anggrainy, T.D. and Sari, A.R., 2022. Implementation of Extract, Transform, Load on Data Warehouse and Business Intelligence Using Pentaho and Tableau to Analyze Sales Performance of Offlist Store. Int. Res. J. Adv. Eng. Sci, 7(2), pp.368-374.
Ashrafi, A., Ravasan, A.Z., Trkman, P. and Afshari, S., 2019. The role of business analytics capabilities in bolstering firms’ agility and performance. International Journal of Information Management, 47, pp.1-15.
Aydiner, A.S., Tatoglu, E., Bayraktar, E., Zaim, S. and Delen, D., 2019. Business analytics and firm performance: The mediating role of business process performance. Journal of business research, 96, pp.228-237.
Božič, K. and Dimovski, V., 2019. Business intelligence and analytics for value creation: The role of absorptive capacity. International journal of information management, 46, pp.93-103.
Caseiro, N. and Coelho, A., 2019. The influence of Business Intelligence capacity, network learning and innovativeness on startups performance. Journal of Innovation & Knowledge, 4(3), pp.139-145.
Jena, B., 2019. An Approach for Forecast Prediction in Data Analytics Field by Tableau Software. International Journal of Information Engineering & Electronic Business, 11(1).
Kraus, M., Feuerriegel, S. and Oztekin, A., 2020. Deep learning in business analytics and operations research: Models, applications and managerial implications. European Journal of Operational Research, 281(3), pp.628-641.
López-Robles, J.R., Otegi-Olaso, J.R., Gómez, I.P. and Cobo, M.J., 2019. 30 years of intelligence models in management and business: A bibliometric review. International journal of information management, 48, pp.22-38.
Mikalef, P., Pappas, I., Krogstie, J. and Pavlou, P., 2019. Big data and business analytics: A research agenda for realizing business value.
Chen, S., Liu, X., Yan, J., Hu, G. and Shi, Y., 2021. Processes, benefits, and challenges for adoption of blockchain technologies in food supply chains: a thematic analysis. Information Systems and e-Business Management, 19(3), pp.909-935.
de Vass, T., Shee, H. and Miah, S.J., 2021. IoT in supply chain management: Opportunities and challenges for businesses in early industry 4.0 context. Operations and Supply Chain Management: An International Journal, 14(2), pp.148-161.
